Supply of Uranium
- Uranium is a relatively common metal, found in rocks and seawater. Economic concentrations of it are not uncommon.
- Quantities of mineral resources are greater than commonly perceived, and are relative to both market prices and cost of extraction.
- The world's known uranium resources increased by at least one-quarter in the last decade due to increased mineral exploration.
Uranium is a relatively common element in the crust of the Earth (very much more than in the mantle). It is a metal approximately as common as tin or zinc, and it is a constituent of most rocks and even of the sea.
Table 1: Typical natural uranium concentrations
| Very high-grade ore (Canada) – 20% U | 200,000 ppm U |
|---|---|
| High-grade ore – 2% U | 20,000 ppm U |
| Low-grade ore – 0.1% U | 1000 ppm U |
| Very low-grade ore* (Namibia) – 0.01% U | 100 ppm U |
| Granite | 3-5 ppm U |
| Sedimentary rock | 2-3 ppm U |
| Earth's continental crust (av) | 2.8 ppm U |
| Seawater | 0.003 ppm U |
ppm = parts per million
* Where uranium is at low levels in rock or sands (certainly less than 1000 ppm) it needs to be in a form which is easily separated for those concentrations to be called 'ore' – that is, implying that the uranium can be recovered economically. This means that it needs to be in a mineral form that can easily be dissolved by sulfuric acid or sodium carbonate leaching.
Total world resources of uranium, as with any other mineral or metal, are not known exactly. The only meaningful measure of long-term security of supply is the known reserves in the ground capable of being mined.
An orebody is, by definition, an occurrence of mineralization from which the metal is economically recoverable. Orebodies, and thus measured resources – the amount known to be economically recoverable from orebodies – are therefore relative to both costs of extraction and market prices. For example, at present neither the oceans nor any granites are orebodies, but conceivably either could become so if prices were to rise sufficiently. At ten times the current price*, seawater, for example, might become a potential source of vast amounts of uranium. Thus, any predictions of the future availability of any mineral, including uranium, which are based on current cost and price data, as well as current geological knowledge, are likely to prove extremely conservative. Factors affecting the supply of resources are discussed further and illustrated in Appendix 2.
* US DOE-funded work using polymer absorbent strips suggest $610/kgU in 2014. Japanese (JAERI) research in 2002 using a polymeric absorbent in a nonwoven fabric containing an amidoxime group that was capable of forming a complex with uranyl tricarbonate ions, suggested about $300/kgU.
Uranium availability
Uranium resources to $130/kg U by country in 2023 (reasonably assured resources plus inferred resources)
| tonnes U | percentage of world | |
| Australia |
1,671,200
|
28%
|
|---|---|---|
| Kazakhstan |
813,900
|
14%
|
| Canada |
582,000
|
10%
|
| Namibia |
497,900
|
8%
|
| Russia | 476,600 | 8% |
| Niger | 336,000 | 6% |
| South Africa | 320,900 | 5% |
| China | 270,500 | 5% |
| Brazil | 167,800 | 3% |
| Mongolia | 144,600 | 2% |
| Ukraine |
106,700
|
2%
|
| Botswana |
87,200
|
1%
|
| USA |
67,800
|
1%
|
| Tanzania | 57,700 | 1% |
| Other |
324,900
|
5%
|
| World total |
5,925,700
|
100%
|
Identified resources recoverable (reasonably assured resources plus inferred resources), to $130/kg U, 1/1/23, from OECD NEA & IAEA, Uranium 2024: Resources, Production and Demand ('Red Book'). The total recoverable identified resources to $260/kg U is 7.935 million tonnes U.
Historical uranium production
Uranium has been successfully mined since the 1940s. Historical uranium production is generally well known, though uncertainties remain about the amount mined in the Soviet Union between 1945 and 1990. Table 3 summarizes historical production. World Nuclear Association has estimated production in countries where data is unavailable.
Table 3: Historical uranium production, 1945-2024
| Cumulative production (tU) | |
| Canada | 579,785 |
|---|---|
| Kazakhstan | 394,168 |
| United States | 378,316 |
| USSR* | 377,613 |
| Australia | 249,870 |
| Germany | 219,685 |
| Namibia | 173,173 |
| South Africa | 166,092 |
| Niger | 158,889 |
| Czech Republic | 112,055 |
| Russia | 96,173 |
| Uzbekistan | 85,065 |
| France | 76,021 |
| China | 53,712 |
| Ukraine | 25,298 |
| Others |
153,800
|
| Total |
3,299,714
|
* Until 1991 USSR comprised the uranium produced in Russia, Kazakhstan, Uzbekistan, Ukraine and other former Soviet Union republics.
Uranium production over the period 1945-2024 can be divided into five distinct phases:
- A military era, from 1945 to the mid-1960s. The generation of electricity from nuclear fuel was incidental to the nuclear arms race. Production rose rapidly in the 1950s to satisfy the requirement for highly enriched uranium and plutonium. Uranium demand fell sharply in the 1960s and, in response, production halved by the mid-1960s.
- Mid-1960s to mid-1980s. A period of rapidly expanding civil nuclear power saw uranium production pick up as reactor orders expanded. Many new mines were brought into production, often underwritten by long-term contracts agreed with electricity utilities in North America, Japan and Western Europe. Western production peaked in 1980 and stayed above annual reactor requirements until 1985.
- Mid-1980s to about 2002. By 1985, the nuclear construction programme had been cut back severely. Many utilities had signed uranium contracts in anticipation of building more plants. Honouring these created a significant overhang. As mines were being run down, many cut production or closed. Utilities satisfied requirements by drawing down their significant inventories, without recourse to new production. The supply overhang was extended due to the arrival on the Western market of uranium from the former Soviet Union starting in 1993.
- Early 2000s to present. There was a strong market reaction to the perception that new primary production would be needed to facilitate an anticipated renaissance in nuclear growth. This took place in the context of a uranium mining sector that had faced unfavourable economic conditions for many years and needed to offset declining and finite secondary supplies. This reaction started in 2003 with a strong upward movement in world uranium prices that continued into 2007 (the spot market price increased by a factor of 13 between early 2003 and mid-2007), but went into a downward correction, accentuated by the Fukushima accident in March 2011. Since the accident, uranium prices have fallen to one of the lowest inflation-adjusted levels ever experienced. This period was also characterized by the rapid expansion of Kazakh production from low-cost tier one assets.
- Late 2010s to present: emerging from post-Fukushima oversupply, uranium market re-adjusts and positions for future growth. Uranium prices fell by more than 70% following the Fukushima accident to levels around $20/lb in 2016-17. Predictably, as supportive term contracts expired in the late 2010s, many uranium producers – large and small and across multiple regions – elected to suspend or curtail operations and meet supply commitments through existing inventory and purchases. Production challenges continued during the Covid-19 pandemic including slower wellfield development at ISR operations, supply chain disruptions, restrictions and delays on transport and regulatory reviews. Prospects for uranium production changed rapidly in the post-pandemic years with energy policy in many countries favouring nuclear power, increased investor interest and direct purchases of uranium inventories, and the Russia-Ukraine conflict creating uncertainty to uranium supply access under resulting trade restrictions. Uranium production continues to respond to more favourable market signals with restarts ongoing and more planned, operating lifetime extensions at existing operations, increased exploration and development spending, and new projects planned. Timely execution of this supply expansion faces challenges but is required to keep pace with anticipated demand growth.
Reactor fuel requirements
The world’s power reactors, with combined capacity of about 400 GWe, require some 67,000 tonnes of uranium from mines or elsewhere each year. While this capacity is being run more productively, with higher capacity factors and reactor power levels, the uranium fuel requirement is increasing, but not necessarily at the same rate. The factors increasing fuel demand are offset by a trend for higher burn-up of fuel and other efficiencies, so demand is steady. (Over the years 1980 to 2008 the electricity generated by nuclear power increased 3.6-fold while uranium used increased by a factor of only 2.5.)
The world's present measured resources of uranium (5.9 Mt) in the cost category less than three times present spot prices and used only in conventional reactors, are enough to last for about 90 years. This represents a higher level of assured resources than is normal for most minerals. Further exploration and higher prices will certainly, on the basis of present geological knowledge, yield further resources as present ones are used up.
Reducing the tails assay in enrichment reduces the amount of natural uranium required for a given amount of fuel. Reprocessing of used fuel from conventional light water reactors also utilizes present resources more efficiently, by a factor of about 1.3 overall. The 2016 and 2018 editions of the Red Book recognized these trends, along with more efficient plant operation, and as a result of which, the report’s generic reactor fuel consumption was reduced from 175 tU per GWe per year at 0.30% tails assay (2012 report) to 160 tU per GWe per year at 0.25% tails assay (2016 report onwards). The corresponding U3O8 figures are 206 tonnes and 189 tonnes. Note that these figures are generalizations across the industry and across many different reactor types.
Today's reactor fuel requirements are met from primary supply and secondary sources: commercial stockpiles, nuclear weapons stockpiles, recycled plutonium and uranium from reprocessing used fuel, and some from re-enrichment of depleted uranium tails (left over from original enrichment). These various secondary sources make uranium unique among energy minerals.
Secondary sources of uranium
The most obvious secondary source is civil stockpiles held by utilities and governments. The amount held here is difficult to quantify, due to commercial confidentiality.
The 2025 edition of the World Nuclear Association Nuclear Fuel Report estimated total inventories end-2024 of 42,000 tU in the USA, 40,000 tU in the European Union, and 65,000 tonnes in East Asia.
Military warheads have been an important source of nuclear fuel since 1987. The USA and countries of the former USSR signed a series of disarmament treaties to reduce the nuclear arsenals of the signatory countries by approximately 80%.
The weapons contained a great deal of uranium enriched to over 90% U-235 (i.e. up to 25 times the proportion in reactor fuel). For two decades, up to 10% of electricity produced in the USA was generated from fuel fabricated using uranium that had been converted from bomb-grade material under the so-called "Megatons to Megawatts" programme. Under the programme, enough bomb-grade material for 20,000 nuclear warheads was eliminated.
Worldwide, until 2013, the conversion of military high-enriched uranium was providing about 15% of the world's reactor requirements.
For more information, see information page on Military warheads as a source of nuclear fuel.
Recycled uranium and plutonium is another source, and currently saves about 2000 tU per year of primary supply, depending on whether just the plutonium or also the uranium is considered. In fact, plutonium is quickly recycled as MOX fuel, whereas the reprocessed uranium (RepU) is mostly stockpiled, but some 16,000 tonnes of RepU from Magnox reactors in the UK has been used to make about 1650 tonnes of enriched AGR fuel. In Belgium, France, Germany and Switzerland over 8000 tonnes of RepU has been recycled into nuclear power plants. For more information, see information page on Processing of Used Nuclear Fuel.
Re-enrichment of depleted uranium (DU, enrichment tails) is another secondary source. There is about 2 million tonnes of depleted uranium available, from both military and civil enrichment activity since the 1940s, most at tails assay of 0.25-0.35% U-235. Non-nuclear uses of DU are very minor relative to annual arisings of over 40,000 tU per year. This leaves most DU available for mixing with recycled plutonium on MOX fuel or as a future fuel resource for fast neutron reactors.
However, some DU that has relatively high assay can be fed through under-utilized enrichment plants to produce natural uranium equivalent, or even enriched uranium ready for fuel fabrication. Russian enrichment plants have treated 10-15,000 tonnes per year of DU assaying over 0.3% U-235, stripping it down to 0.1% and producing a few thousand tonnes per year of natural uranium equivalent. This Russian programme treating Western tails has now finished.
Underfeeding at enrichment plants is a significant source of secondary supply, especially since the Fukushima accident reduced enrichment demand for several years. This is where the operational tails assay is lower than the contracted/transactional assay, and the enricher sets aside some surplus natural uranium, which it is free to sell (either as natural uranium or as enriched uranium product) on its own account.
International fuel reserves
There have been three major initiatives to set up international reserves of enriched fuel, two of them multilateral ones, with fuel to be available under International Atomic Energy Agency (IAEA) auspices despite any political interruptions which might affect countries needing them. The third is under US auspices, and also to meet needs arising from supply disruptions.
Russian LEU reserve
Russia opened an international fuel bank at its Angarsk enrichment facility in December 2010. The fuel bank is under IAEA control and holds 123 tU as LEU enriched to between 2.0% and 4.95% U-235 representing two full fuel loads for a typical 1000 MWe LWR reactor. The fuel is available to any IAEA member state in good standing, which is unable to procure LEU or its components for political reasons. However, the fuel bank does not cover any fabrication of fuel assemblies.
IAEA LEU bank
In December 2010 the IAEA board resolved to establish a similar guaranteed reserve of low-enriched uranium, the IAEA LEU Bank*. It comprises a physical stock of UF6 owned by the IAEA, which shall "be responsible for storing and protecting" it. According to international norms, such a 'fuel bank' must be located in a country with no nuclear weapons and be fully open to IAEA inspectors. The fuel bank will be a potential supply of 90 tonnes LEU (as UF6) for the production of fuel assemblies for nuclear power plants. The Kazakh government in April 2015 approved a draft agreement with the IAEA for this. In June 2015 the IAEA board approved plans for the IAEA LEU Bank to be located at the Ulba Metallurgical Plant (UMP) at Ust-Kamenogorsk (aka Oskemen) and operated by Kazakhstan. A formal agreement with Kazakhstan to establish the legal framework was signed in August. A transit agreement with Russia for shipping LEU was also approved. An agreement between the IAEA and UMP was signed in May 2016. The facility was formally opened at the end of August 2017. In October 2019 the facility became operational, taking delivery of the first shipment of LEU, and in November it awarded contracts to Orano and Kazatomprom to supply it.
* ‘LEU IAEA’ is defined as LEU owned by the IAEA in the form of uranium hexafluoride (UF6) with a nominal enrichment of U-235 to 4.95%. It comprises up to 60 full containers of the 30B type or later versions. Type 30B cylinders each hold 2.27 t UF6 (1.54 tU), hence about 92 tU. The IAEA bears the costs of the purchase and delivery (import-export) of LEU, the purchase of equipment and its operation, technical resources and other goods and services required. Kazakhstan will meet the costs of LEU storage, including payment of electricity, heating, office space and staff costs. The agreement allows for the possible transfer of the LEU fuel bank to another site from the Ulba Metallurgical Plant, and it has a ten-year duration with automatic renewal at the end of this period.
The IAEA LEU Bank is fully funded by voluntary contributions including $50 million from the US-based Nuclear Threat Initiative (NTI) organization, $49 million from the USA, up to $25 million from the European Union, $10 million each from Kuwait and the United Arab Emirates, and $5 million from Norway.
American assured fuel supply
In 2005 the US government announced plans for the establishment of a mechanism to ensure fuel supply for use in commercial reactors in foreign countries where there has been supply disruption. The fuel would come from downblending 17.4 tonnes of high-enriched uranium (HEU). In August 2011 US Department of Energy announced an expanded scope for the programme so it would also serve US utility needs, and now be called the American Assured Fuel Supply (AFS). At that point most of the downblending of the HEU had been completed, and the scheme was ready to operate. The AFS comprises 286 tonnes of low-enriched uranium (with another 60t from downblending being sold on the market to pay for the work). Additionally, the USA has completed the process of downblending another 20.1 tonnes of HEU. The AFS programme is administered by the US National Nuclear Safety Administration, foreign access must be through a US entity, and the fuel will be sold at current market prices. The 286 t amount is equivalent to about six reloads for a 1000 MWe reactor.
Unconventional resources
In addition to the over 6 million tonnes of uranium in the world's known recoverable resources, there are substantial amounts comprising what is known as 'unconventional resources'. Such unconventional resources, from which uranium can be produced in conjunction with other metals, as by-product, have accounted for over 11% of historical uranium production.
The main unconventional resource for uranium is rock phosphate, or phosphorite, and some 20,000 tU has been recovered as a by-product of agricultural phosphate production to the 1990s, but it then became uneconomic. EEstimates of the amount available widely. The 2024 Red Book tabulates 7100 tU at <$130/kgU and 45,900 tU at <$260/kgU.
With uranium as a minor by-product of phosphates, the potential supply is tied to the economics of phosphate production, as well as the uranium price, coupled with the environmental benefits of removing uranium from the waste stream and/or product. World phosphorous pentoxide (P2O5) production capacity from about 250 Mt of rock phosphate is about 50 million tonnes per year. From 1981 to 1992 US production from central Florida's phosphate deposits as by-product averaged just over 1000 tU per year, comprising up to 20% of US total, then fell away sharply and finished in 1998. Morocco has by far the largest known resources of uranium in phosphate rock.
Rare earth element (REE) deposits are another such unconventional resource. REEs have unique catalytic, metallurgical, nuclear, electrical, magnetic and luminescent properties, and play a critical role in the application of many modern technologies, including magnetic resonance imaging (MRI) machines, satellites, batteries, LED screens and solar panels. China is the leading supplier of REEs, giving rise to commercial pressure for development of deposits elsewhere.
REEs are a set of 17 chemical elements in the periodic table, specifically the 15 contiguous lanthanides plus the lighter scandium and yttrium. Scandium and yttrium are considered REEs since they tend to occur in the same ore deposits as the lanthanides and exhibit similar physical and chemical properties. REEs are in fact relatively abundant in the Earth's crust, but are rarely found in concentrations that are economically exploitable. REE resources occur in four primary geological settings: carbonatites, ion-absorption clay deposits, igneous systems and monzanite-xenotime placer deposits. REE resources are usually reported as rare earth oxides (REO).
Kvanefjeld in Greenland is the main REE deposit with major potential for uranium production, with Sorensen, Zone 3 and Steenstrupfjeld orebodies in the same Ilimaussac intrusive complex. Those four deposits have a total of 228,000 tU (May 2015, JORC-compliant), nearly half of it measured and indicated resources. Greenland Minerals has an agreement with Chinese company Shenghe Resources which would enable development to proceed.
Black (Alum) shales are another unconventional resource with some attempts being made to exploit them. The 2024 Red Book tabulates 15,200 tU at <$260/kgU.
Thorium as a nuclear fuel
Today uranium is the only fuel supplied for nuclear reactors. However, thorium can also be utilized as a fuel for CANDU reactors or in reactors specially designed for this purpose. Neutron efficient reactors, such as CANDU, are capable of operating on a thorium fuel cycle, once they are started using a fissile material such as U-235 or Pu-239. Then the thorium (Th-232) atom captures a neutron in the reactor to become fissile uranium (U-233), which continues the reaction. Some advanced reactor designs are likely to be able to make use of thorium on a substantial scale.
The thorium fuel cycle has some attractive features, though it is not yet in commercial use. Thorium is reported to be about three times as abundant in the Earth's crust as uranium. The 2009 IAEA-NEA Red Book listed 3.6 million tonnes of known and estimated resources as reported, but points out that this excludes data from much of the world, and estimated about 6 million tonnes overall. For more information, see paper on Thorium.
Notes & references
General sources
OECD NEA & IAEA, Uranium 2024: Resources, Production and Demand
OECD NEA & IAEA, Uranium 2022: Resources, Production and Demand
World Nuclear Association, 2025, The Nuclear Fuel Report – Global Scenarios for Demand and Supply Availability 2025-2040
World Nuclear Association, 2023, The Nuclear Fuel Report – Global Scenarios for Demand and Supply Availability 2023-2040
World Nuclear Association, 2021, The Nuclear Fuel Report – Global Scenarios for Demand and Supply Availability 2021-2040
UN Institute for Disarmament Research, Yury Yudin (ed) 2011, Multilateralization of the Nuclear Fuel Cycle – The First Practical Steps
A. Monnet, CEA, Uranium from Coal Ash: Resource assessment and outlook, IAEA URAM 2014
Appendices
Appendix 1: Mineral resources and reserves
The following are internationally-recognized categories based on Australia's JORC code, which the Canadian NI 43-101 code follows.
A ‘mineral resource’ is a known concentration of minerals in the Earth’s crust with reasonable prospects for eventual economic extraction. Mineral resources are sub-divided, in order of increasing geological confidence, into inferred, indicated and measured categories.
- An ‘inferred' mineral resource is that part of a mineral resource for which tonnage, grade and mineral content can be estimated with only a low level of confidence. The information on which it is based is limited, or of uncertain quality and reliability.
- An 'indicated' mineral resource is that part of a mineral resource for which tonnage, grade and mineral content can be estimated with a reasonable level of confidence. It is based on exploration, sampling and testing information which is adequate to assume but not confirm geological and/or grade continuity.
- A ‘measured' mineral resource is that part of a mineral resource for which tonnage, physical characteristics, grade and mineral content can be estimated with a high level of confidence. It is based on detailed and reliable exploration, sampling and testing information with locations spaced closely enough to confirm geological and grade continuity.
A ‘mineral' reserve (or ore reserve) is the economically mineable part of a measured and/or indicated mineral resource. It allows for dilution and losses which may occur when the material is mined. Appropriate assessments and studies will have been carried out, and include consideration of realistically assumed mining, metallurgical, economic, marketing, legal, environmental, social and governmental factors. Mineral or ore reserves are sub-divided in order of increasing confidence into probable mineral/ore reserves and proved mineral/ore reserves.
- A ‘probable' mineral reserve (or probable ore reserve) is the economically mineable part of an indicated mineral resource. Studies to at least pre-feasibility level will have been carried out, demonstrating that extraction could reasonably be justified.
- A ‘proved' mineral reserve (or proved ore reserve) is the economically mineable part of a measured mineral resource. Studies to at least pre-feasibility level will have been carried out, demonstrating that extraction is justified.
Appendix 2: The Sustainability of Mineral Resources (September 2005)
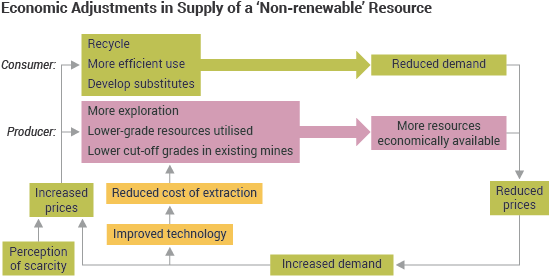
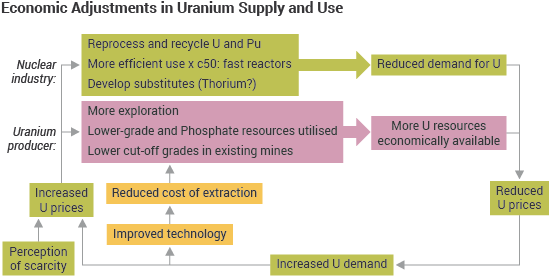
Substantially derived from 2003 WNA Symposium paper by Colin MacDonald, Uranium: Sustainable Resource or Limit to Growth? – supplemented by his 2005 WNA Symposium paper and including a model Economic adjustments in the supply of a 'non-renewable' resource from Ian Hore-Lacy.
It is commonly asserted that because "the resources of the earth are finite", therefore we must face some day of reckoning, and will need to plan for "negative growth". All this, it is pointed out, is because these resources are being consumed at an increasing rate to support our western lifestyle and to cater for the increasing demands of developing nations. The assertion that we are likely to run out of resources is a re-run of the "Limits to Growth" argument (Club of Rome 1972 popularized by Meadows et al in Limits of Growth at that time. (A useful counter to it is W Berckerman, In Defence of Economic Growth, also Singer, M, Passage to a Human World, Hudson Inst. 1987). In the decade following its publication world bauxite reserves increased 35%, copper 25%, nickel 25%, uranium and coal doubled, gas increased 70% and even oil increased 6%.) fashionable in the early 1970s, which was substantially disowned by its originators, the Club of Rome, and shown up as nonsense with the passing of time. It also echoes similar concerns raised by economists in the 1930s, and by Malthus at the end of the 18th Century.
In recent years there has been persistent misunderstanding and misrepresentation of the abundance of mineral resources, with the assertion that the world is in danger of actually running out of many mineral resources. While congenial to common sense if the scale of the Earth's crust is ignored, it lacks empirical support in the trend of practically all mineral commodity prices and published resource figures over the long term. In recent years some have promoted the view that limited supplies of natural uranium are the Achilles heel of nuclear power as the sector contemplates a larger contribution to future clean energy, notwithstanding the small amount of it required to provide very large amounts of energy.
Uranium supply news is usually framed within a short-term perspective. It concerns who is producing with what resources, who might produce or sell, and how does this balance with demand? However, long-term supply analysis enters the realm of resource economics. This discipline has as a central concern the understanding of not just supply/demand/price dynamics for known resources, but also the mechanisms for replacing resources with new ones presently unknown. Such a focus on sustainability of supply is unique to the long view. Normally-functioning metals markets and technology change provide the drivers to ensure that supply at costs affordable to consumers is continuously replenished, both through the discovery of new resources and the re-definition (in economic terms) of known ones.
Of course the resources of the earth are indeed finite, but three observations need to be made: first, the limits of the supply of resources are so far away that the truism has no practical meaning. Second, many of the resources concerned are either renewable or recyclable (energy minerals and zinc are the main exceptions, though the recycling potential of many materials is limited in practice by the energy and other costs involved). Third, available reserves of 'non-renewable' resources are constantly being renewed, mostly faster than they are used.
There are three principal areas where resource predictions have faltered:
- predictions have not accounted for gains in geological knowledge and understanding of mineral deposits;
- they have not accounted for technologies utilized to discover, process and use them;
- economic principles have not been taken into account, which means that resources are thought of only in present terms, not in terms of what will be economic through time, nor with concepts of substitution in mind.
What then does sustainability in relation to mineral resources mean? The answer lies in the interaction of these three things which enable usable resources (Some licence is taken in the use of this word in the following, strictly it is reserves of minerals which are created) effectively to be created. They are brought together in the diagram below.
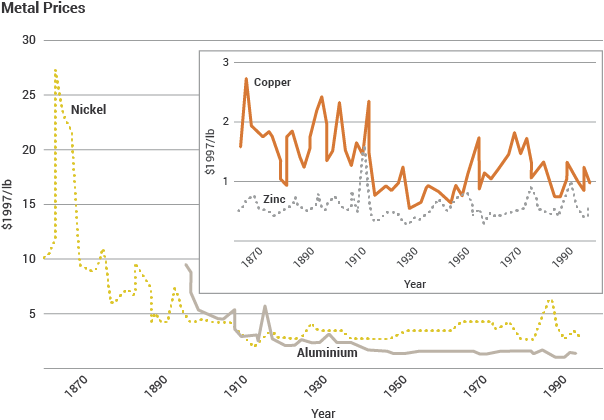
Numerous economists have studied resource trends to determine which measures should best reflect resource scarcity (Tilton, J. On Borrowed Time? Assessing the threat of mineral depletion, Resources for the Future, Washington DC 2002). Their consensus view is that costs and prices, properly adjusted for inflation, provide a better early warning system for long-run resource scarcity than do physical measures such as resource quantities.
Historic data show that the most commonly used metals have declined in both their costs and real commodity prices over the past century. Such price trends are the most telling evidence of lack of scarcity. Uranium has been a case in point, relative to its late 1970s price of US$ 40/lb U3O8.
An anecdote underlines this basic truth: In 1980 two eminent professors, fierce critics of one another, made a bet regarding the real market price of five metal commodities over the next decade. Paul Ehrlich, a world-famous ecologist, bet that because the world was exceeding its carrying capacity, food and commodities would start to run out in the 1980s and prices in real terms would therefore rise. Julian Simon, an economist, said that resources were effectively so abundant, and becoming effectively more so, that prices would fall in real terms. He invited Ehrlich to nominate which commodities would be used to test the matter, and they settled on these (chrome, copper, nickel, tin and tungsten). In 1990 Ehrlich paid up - all the prices had fallen.
However, quantities of known resources tell a similar and consistent story. To cite one example, world copper reserves in the 1970s represented only 30 years of then-current production (6.4 Mt/yr). Many analysts questioned whether this resource base could satisfy the large expected requirements of the telecommunications industry by 2000. But by 1994, world production of copper had doubled (12 Mt/yr) and the available reserves were still enough for another 30 years. The reserve multiple of current production remained the same.
Another way to understand resource sustainability is in terms of economics and capital conservation. Under this perspective, mineral resources are not so much rare or scarce as they are simply too expensive to discover if you cannot realize the profits from your discovery fairly soon. Simple economic considerations therefore discourage companies from discovering much more than society needs through messages of reduced commodity prices during times of oversupply. Economically rational players will only invest in finding these new reserves when they are most confident of gaining a return from them, which usually requires positive price messages caused by undersupply trends. If the economic system is working correctly and maximizing capital efficiency, there should never be more than a few decades of any resource commodity in reserves at any point in time.
The fact that many commodities have more resources available than efficient economic theory might suggest may be partly explained by two characteristics of mineral exploration cycles. First, the exploration sector tends to over-respond to the positive price signals through rapid increases in worldwide expenditures (which increases the rate of discoveries), in particular through the important role of more speculatively-funded junior exploration companies. Exploration also tends to make discoveries in clusters that have more to do with new geological knowledge than with efficient capital allocation theory. As an example, once diamonds were known to exist in northern Canada, the small exploration boom that accompanied this resulted in several large discoveries – more than the market may have demanded at this time. These patterns are part of the dynamics that lead to commodity price cycles. New resource discoveries are very difficult to precisely match with far-off future demand, and the historic evidence suggests that the exploration process over-compensates for every small hint of scarcity that the markets provide.
Another important element in resource economics is the possibility of substitution of commodities. Many commodity uses are not exclusive – should they become too expensive they can be substituted with other materials. Even if they become cheaper they may be replaced, as technology gains have the potential to change the style and cost of material usage. For example, copper, despite being less expensive in real terms than 30 years ago, is still being replaced by fibre optics in many communication applications. These changes to materials usage and commodity demand provide yet another dimension to the simple notion of depleting resources and higher prices.
In summary, historic metals price trends, when examined in the light of social and economic change through time, demonstrate that resource scarcity is a double-edged sword. The same societal trends that have increased metals consumption, tending to increase prices, have also increased the available wealth to invest in price-reducing knowledge and technology. These insights provide the basis for the economic sustainability of metals, including uranium.
Geological knowledge
Whatever minerals are in the earth, they cannot be considered usable resources unless they are known. There must be a constant input of time, money and effort to find out what is there. This mineral exploration endeavour is not merely fossicking or doing aerial magnetic surveys, but must eventually extend to comprehensive investigation of orebodies so that they can reliably be defined in terms of location, quantity and grade. Finally, they must be technically and economically quantified as mineral reserves. That is the first aspect of creating a resource. See section in paper for mineral resource and reserve categories.
For reasons outlined above, measured resources of many minerals are increasing much faster than they are being used, due to exploration expenditure by mining companies and their investment in research. Simply on geological grounds, there is no reason to suppose that this trend will not continue. Today, proven mineral resources worldwide are more than we inherited in the 1970s, and this is especially so for uranium.
Simply put, metals which are more abundant in the Earth's crust are more likely to occur as the economic concentrations we call mineral deposits. They also need to be reasonably extractable from their host minerals. By these measures, uranium compares very well with base and precious metals. Its average crustal abundance of 2.7 ppm is comparable with that of many other metals such as tin, tungsten, and molybdenum. Many common rocks such as granite and shales contain even higher uranium concentrations of 5 to 25 ppm. Also, uranium is predominantly bound in minerals which are not difficult to break down in processing.
As with crustal abundance, metals which occur in many different kinds of deposits are easier to replenish economically, since exploration discoveries are not constrained to only a few geological settings. Currently, at least 14 different types of uranium deposits are known, occurring in rocks of wide range of geological age and geographic distribution. There are several fundamental geological reasons why uranium deposits are not rare, but the principal reason is that uranium is relatively easy both to place into solution over geological time, and to precipitate out of solution in chemically reducing conditions. This chemical characteristic alone allows many geological settings to provide the required hosting conditions for uranium resources. Related to this diversity of settings is another supply advantage ?the wide range in the geological ages of host rocks ensures that many geopolitical regions are likely to host uranium resources of some quality.
Unlike the metals which have been in demand for centuries, society has barely begun to utilize uranium. As serious non-military demand did not materialize until significant nuclear generation was built by the late 1970s, there has been only one cycle of exploration-discovery-production, driven in large part by late 1970s price peaks (MacDonald, C, Rocks to reactors: Uranium exploration and the market. Proceedings of WNA Symposium 2001). This initial cycle has provided more than enough uranium for the last three decades and several more to come. Clearly, it is premature to speak about long-term uranium scarcity when the entire nuclear industry is so young that only one cycle of resource replenishment has been required. It is instead a reassurance that this first cycle of exploration was capable of meeting the needs of more than half a century of nuclear energy demand.
Related to the youthfulness of nuclear energy demand is the early stage that global exploration had reached before declining uranium prices stifled exploration in the mid-1980s. The significant investment in uranium exploration during the 1970-82 exploration cycle would have been fairly efficient in discovering exposed uranium deposits, due to the ease of detecting radioactivity. Still, very few prospective regions in the world have seen the kind of intensive knowledge and technology-driven exploration that the Athabasca Basin of Canada has seen since 1975. This fact has huge positive implications for future uranium discoveries, because the Athabasca Basin history suggests that the largest proportion of future resources will be as deposits discovered in the more advanced phases of exploration. Specifically, only 25% of the 635,000 tonnes of U3O8 discovered so far in the Athabasca Basin could be discovered during the first phase of surface-based exploration. A sustained second phase, based on advances in deep penetrating geophysics and geological models, was required to discover the remaining 75%.
Another dimension to the immaturity of uranium exploration is that it is by no means certain that all possible deposit types have even been identified. Any estimate of world uranium potential made only 30 years ago would have missed the entire deposit class of unconformity deposits that have driven production since then, simply because geologists did not know this class existed.
Technology
It is meaningless to speak of a resource until someone has thought of a way to use any particular material. In this sense, human ingenuity quite literally creates new resources, historically, currently and prospectively. That is the most fundamental level at which technology creates resources, by making particular minerals usable in new ways. Often these then substitute to some degree for others which are becoming scarcer, as indicated by rising prices. Uranium was not a resource in any meaningful sense before 1940.
More particularly, if a known mineral deposit cannot be mined, processed and marketed economically, it does not constitute a resource in any practical sense. Many factors determine whether a particular mineral deposit can be considered a usable resource – the scale of mining and processing, the technological expertise involved, its location in relation to markets, and so on. The application of human ingenuity, through technology, alters the significance of all these factors and is thus a second means of 'creating' resources. In effect, portions of the earth's crust are reclassified as resources. A further aspect of this is at the manufacturing and consumer level, where technology can make a given amount of resources go further through more efficient use.(aluminium can mass was reduced by 21% 1972-88, and motor cars each use about 30% less steel than 30 years ago)
An excellent example of this application of technology to create resources is in the Pilbara region of Western Australia. Until the 1960s the vast iron ore deposits there were simply geological curiosities, despite their very high grade. Australia had been perceived as short of iron ore. With modern large-scale mining technology and the advent of heavy duty railways and bulk shipping which could economically get the iron ore from the mine (well inland) through the ports of Dampier and Port Hedland to Japan, these became one of the nation's main mineral resources. For the last 45 years Hamersley Iron (Rio Tinto), Mount Newman (BHP-Billiton) and others have been at the forefront of Australia's mineral exporters, drawing upon these 'new' orebodies.
Just over a hundred years ago aluminium was a precious metal, not because it was scarce, but because it was almost impossible to reduce the oxide to the metal, which was therefore fantastically expensive. With the discovery of the Hall-Heroult process in 1886, the cost of producing aluminium plummeted to about one twentieth of what it had been and that metal has steadily become more commonplace. It now competes with iron in many applications, and copper in others, as well as having its own widespread uses in every aspect of our lives. Not only was a virtually new material provided for people's use by this technological breakthrough, but enormous quantities of bauxite world-wide progressively became a valuable resource. Without the technological breakthrough, they would have remained a geological curiosity.
Incremental improvements in processing technology at all plants are less obvious but nevertheless very significant also. Over many years they are probably as important as the historic technological breakthroughs.
To achieve sustainability, the combined effects of mineral exploration and the development of technology need to be creating resources at least as fast as they are being used. There is no question that in respect to the minerals industry this is generally so, and with uranium it is also demonstrable. Recycling also helps, though generally its effect is not great.
Economics
Whether a particular mineral deposit is sensibly available as a resource will depend on the market price of the mineral concerned. If it costs more to get it out of the ground than its value warrants, it can hardly be classified as a resource (unless there is some major market distortion due to government subsidies of some kind). Therefore, the resources available will depend on the market price, which in turn depends on world demand for the particular mineral and the costs of supplying that demand. The dynamic equilibrium between supply and demand also gives rise to substitution of other materials when scarcity looms (or the price is artificially elevated). This then is the third aspect of creating resources.
The best known example of the interaction of markets with resource availability is in the oil industry. When in 1972 OPEC suddenly increased the price of oil fourfold, several things happened at both producer and consumer levels.
The producers dramatically increased their exploration effort, and applied ways to boost oil recovery from previously 'exhausted' or uneconomic wells. At the consumer end, increased prices meant massive substitution of other fuels and greatly increased capital expenditure in more efficient plant. As a result of the former activities, oil resources increased dramatically. As a result of the latter, oil use fell slightly to 1975 and in the longer perspective did not increase globally from 1973 to 1986. Forecasts in 1972, which had generally predicted a doubling of oil consumption in ten years, proved quite wrong.
Oil will certainly become scarce one day, probably before most other mineral resources, which will continue to drive its price up. As in the 1970s, this will in turn cause increased substitution for oil and bring about greater efficiencies in its use as equilibrium between supply and demand is maintained by the market mechanism. Certainly oil will never run out in any absolute sense – it will simply become too expensive to use as liberally as we now do.
Another example is provided by aluminium. During World War II, Germany and Japan recovered aluminium from kaolinite, a common clay, at slightly greater cost than it could be obtained from bauxite.
Due to the operation of these three factors the world's economically demonstrated resources of most minerals have risen faster than the increased rate of usage over the last 50 years, so that more are available now, notwithstanding liberal usage. This is largely due to the effects of mineral exploration and the fact that new discoveries have exceeded consumption.
Replacement of uranium
A characteristic of metals resource replacement is that the mineral discovery process itself adds a small cost relative to the value of the discovered metals. As an example, the huge uranium reserves of Canada's Athabasca Basin were discovered for about US$1.00/kgU (2003 dollars, including unsuccessful exploration). Similar estimates for world uranium resources, based on published IAEA exploration expenditure data and assuming that these expenditures yielded only the past uranium produced plus the present known economic resources categories at up to US$80/kg (Uranium 2003: Resources, Production and demand. Nuclear Energy Agency and IAEA, OECD Publications 2004) yields slightly higher costs of about US$1.50/kgU. This may reflect the higher component of State-driven exploration globally, some of which had national self-sufficiency objectives that may not have aligned with industry economic standards.
From an economic perspective, these exploration costs are essentially equivalent to capital investment costs, albeit spread over a longer time period. It is, however, this time lag between the exploration expense and the start of production that confounds attempts to analyse exploration economics using strict discounted cash flow methods. The positive cash flows from production occur at least 10-15 years into the future, so that their present values are obviously greatly reduced, especially if one treats the present as the start of exploration. This creates a paradox, since large resource companies must place a real value on simply surviving and being profitable for many decades into the future; and, without exploration discoveries, all mining companies must expire with their reserves. Recent advances in the use of real options and similar methods are providing new ways to understand this apparent paradox. A key insight is that time, rather than destroying value through discounting, actually adds to the option value, as does the potential of price volatility. Under this perspective, resource companies create value by obtaining future resources which can be exploited optimally under a range of possible economic conditions. Techniques such as these are beginning to add analytical support to what have always been intuitive understandings by resource company leaders – that successful exploration creates profitable mines and adds value to company shares.
Since uranium is part of the energy sector, another way to look at exploration costs is on the basis of energy value. This allows comparisons with the energy investment cost for other energy fuels, especially fossil fuels which will have analogous costs related to the discovery of the resources. From numerous published sources, the finding costs of crude oil have averaged around US$ 6/bbl over at least the past three decades. Uranium's finding costs make up only 2% of the recent spot price of US$ 30/lb ($78/kgU), while the oil finding costs are 12% of a recent spot price of US$ 50/bbl.
By these measures, uranium is a very inexpensive energy source to replenish, as society has accepted far higher energy replacement costs to sustain oil resources. This low basic energy resource cost is one argument in favour of a nuclear-hydrogen solution to long-term replacement of oil as a transportation fuel.
Forecasting replenishment
Supply forecasters are often reluctant to consider the additive impacts of exploration on new supply, arguing that assuming discoveries is as risky and speculative as the exploration business itself. Trying to predict any single discovery certainly is speculative. However, as long as the goal is merely to account for the estimated total discovery rate at a global level, a proxy such as estimated exploration expenditures can be used. Since expenditures correlate with discovery rate, the historic (or adjusted) resources discovered per unit of expenditure will provide a reasonable estimate of resource gains to be expected. As long as the time lag between discovery and production is accounted for, this kind of dynamic forecasting is more likely to provide a basis for both price increases and decreases, which metals markets have historically demonstrated.
Without these estimates of uranium resource replenishment through exploration cycles, long-term supply-demand analyses will tend to have a built-in pessimistic bias (i.e. towards scarcity and higher prices), that will not reflect reality. Not only will these forecasts tend to overestimate the price required to meet long-term demand, but the opponents of nuclear power use them to bolster arguments that nuclear power is unsustainable even in the short term. In a similar fashion, these finite-resources analyses also lead observers of the industry to conclude that fast breeder reactor technology will soon be required. This may indeed make a gradual appearance, but if uranium follows the price trends we see in other metals, its development will be due to strategic policy decisions more than uranium becoming too expensive.
The resource economics perspective tells us that new exploration cycles should be expected to add uranium resources to the world inventory, and to the extent that some of these may be of higher quality and involve lower operating cost than resources previously identified, this will tend to mitigate price increases. This is precisely what has happened in uranium, as the low-cost discoveries in Canada's Athabasca Basin have displaced higher-cost production from many other regions, lowering the cost curve and contributing to lower prices. Secondary uranium supplies, to the extent that they can be considered as a very low-cost mine, have simply extended this price trend.
The first exploration and mining cycle for uranium occurred about 1970 to 1985. It provided enough uranium to meet world demand for some 80 years, if we view present known resources as arising from it. With the rise in uranium prices to September 2005 and the concomitant increase (boom?) in mineral exploration activity, it is clear that we have the start of a second such cycle, mid-2003 to ??. The price increase was brought about by diminution of secondary supplies coupled with a realization that primary supplies needed to increase substantially.
Several significant decisions on mine development and increased exploration by major producers will enable this expansion of supply, coupled with smaller producers coming on line. The plethora of junior exploration companies at the other end of the spectrum which are finding no difficulty whatever in raising capital are also a positive sign that a vigorous new exploration and mining cycle is cranking up. From lows of around US$ 55 million per year in 2000, world uranium exploration expenditure rose to about US$ 110 million in 2004 and is expected to be US$ 185 million in 2005, half of this being from the junior exploration sector. The new cycle is also showing considerable regional diversification. Measured from 1990, cycle 2 totals US$ 1.5 billion to 2005, compared with a total of about three times this figure (uncorrected) for the whole of the first cycle.
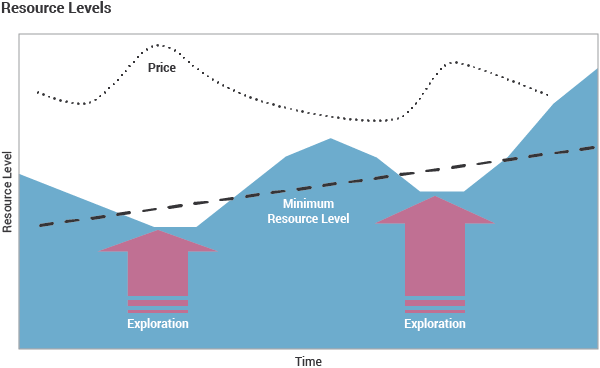
Depletion and sustainability
Conversely, the exhaustion of mineral resources during mining is real. Resource economists do not deny the fact of depletion, nor its long-term impact – that in the absence of other factors, depletion will tend to drive commodity prices up. But as we have seen, mineral commodities can become more available or less scarce over time if the cost-reducing effects of new technology and exploration are greater than the cost-increasing effects of depletion.
One development that would appear to argue against economic sustainability is the growing awareness of the global depletion of oil, and in some regions such as North America, natural gas. But oil is a fundamentally different material. This starts with geology, where key differences include the fact that oil and gas were formed by only one process: the breakdown of plant life on Earth. Compared with the immense volumes of rock-forming minerals in the Earth? crust, living organisms on top of it have always been a very tiny proportion. But a more important fact is that the world has consumed oil, and recently natural gas as well, in a trajectory of rapid growth virtually unmatched by any other commodity. Consumption growth rates of up to 10% annually over the past 50 years are much higher than we see for other commodities, and support the contention that oil is a special depletion case for several reasons: its geological occurrence is limited, it has been inexpensive to extract, its energy utility has been impossible to duplicate for the price, and its resulting depletion rates have been incredibly high.
This focus on rates of depletion suggests that one of the dimensions of economic sustainability of metals has to do with their relative rates of depletion. Specifically, it suggests that economic sustainability will hold indefinitely as long as the rate of depletion of mineral resources is slower than the rate at which it is offset. This offsetting force will be the sum of individual factors that work against depletion, and include cost-reducing technology and knowledge, lower cost resources through exploration advances, and demand shifting through substitution of materials.
An economic sustainability balance of this type also contemplates that, at some future point, the offsetting factors may not be sufficient to prevent irreversible depletion-induced price increases, and it is at this point that substituting materials and technologies must come into play to take away demand. In the case of rapid oil depletion, that substitute appears to be hydrogen as a transport fuel. Which raises the question of how the hydrogen is produced, and nuclear energy seems the most likely means of that, using high-temperature reactors.
From a detached viewpoint all this may look like mere technological optimism. But to anyone closely involved it is obvious and demonstrable. Furthermore, it is illustrated by the longer history of human use of the Earth's mineral resources. Abundance, scarcity, substitution, increasing efficiency of use, technological breakthroughs in discovery, recovery and use, sustained incremental improvements in mineral recovery and energy efficiency – all these comprise the history of minerals and humankind.
Related information
Military Warheads as a Source of Nuclear FuelProcessing of Used Nuclear Fuel
Uranium from Phosphates