Mineral Requirements for Electricity Generation
Green technologies are being deployed with the aim of making modern societies more sustainable. It is therefore essential to consider the mineral resource and physical mining realities associated with the energy transition.
Many energy technologies being deployed as part of the energy transition are material- and mineral-intensive. For example, electric vehicles (EVs) are six times more intensive for critical minerals than the fossil fuel alternatives they replace. As efforts to reduce carbon emissions continue, the energy sector will become the principal source of demand for base and niche metals worldwide.
Understanding the overall environmental and social impacts of low-carbon technologies requires careful consideration of the extractive and processing activities involved in their deployment. In 2017 the World Bank warned: “a green technology future is materially intensive, and, if not properly managed, could bely the efforts… of meeting climate and related Sustainable Development Goals.”1 In 2021 the International Energy Agency (IEA) warned: “Today’s supply and investment plans for many critical minerals fall well short of what is needed to support an accelerated deployment of solar panels, wind turbines and electric vehicles.”
Energy sources are labelled ‘renewable’ on the basis that they use resources (e.g. sunlight, wind) that are in one sense unlimited, though at any time and place they may be very limited, even zero. In any case, to harness these renewable sources of energy, plants must be built, which requires the extraction and use of finite mineral resources. Moreover, the mineral demand intensity of a given generation technology is tightly linked to the energy density of the source of energy it uses. As such, the lower power density of intermittent renewable energies (i.e. solar and wind*) translates into substantially higher material demand as complex infrastructure must be distributed over large areas to gather diffuse energy. Harnessing the potential energy of pumped hydro storage is, of course, more straightforward where there are suitable geographical conditions.
* These are frequently referred to as variable renewable energy (VRE) sources. However, hydropower is also a variable source, but it is dispatchable on demand. The availability of wind and solar is uncontrollable and intermittent, hence that term is used here.
The IEA in 2021 published a World Energy Outlook special report on The Role of Critical Minerals in Clean Energy Transitions. It said that the rise of low-carbon power generation to meet climate goals will triple mineral demand from the sector by 2040 in its Sustainable Development Scenario (SDS) and double it in the Stated Energy Policy Scenario (STEPS)*. Demand is driven by material-intensive wind and solar, with hydropower, biomass and nuclear having “comparatively low mineral requirements”.
* The IEA’s SDS outlines a major transformation of the global energy system, showing how the world can change course to deliver on the three main energy-related UN Sustainable Development Goals (SDGs) simultaneously. The STEPS scenario reflects the impact of existing policy frameworks and intentions.
The rapid growth of hydrogen use in the SDS underpins major growth in demand for nickel and zirconium for use in electrolyzers, and for copper and platinum-group metals for use in fuel cell electric vehicles (FCEVs). Demand for platinum-group metals in FCEVs adds to that for catalytic converters in internal combustion engine cars in 2040. Demand for rare earths – primarily for EV motors and wind turbines – grows threefold in the STEPS and around sevenfold in the SDS by 2040.
Increasing extractive and processing activities from the widespread deployment of intermittent renewables and other clean energy technologies will have significant environmental and social implications which need to be managed responsibly. Nuclear’s high energy density provides innate sustainability advantages when considering mineral usage.
Finite resources and energy density
All kinds of energy-producing machinery require materials to be extracted from the Earth for their fabrication. Different sources of energy require different machinery in order to be ‘harvested’ and so demand different types and quantities of materials. All energy-producing machinery has an operational lifetime, after which it must be replaced. So no form of energy is, therefore, in any meaningful sense, fully ‘renewable’; all require continual mining and processing of tonnes of primary material for the plant if not the fuel.
The lower energy density of intermittent renewable energy compared with fossil fuels and nuclear energy translates directly and inexorably to a greater mineral/material demand per unit of energy. Estimates vary but producing electricity from wind and solar typically increases the quantities of materials requiring extraction, processing and handling by a factor of at least 10.
A significant expansion of wind and solar power, as well as other technologies associated with a transition from fossil fuels, will create a burgeoning demand for minerals. As an example, according to the IEA, since 2015 EVs and grid-connected battery storage have surpassed consumer electronics to become the largest source of demand for lithium, accounting for 30% of total demand now. Clean energy technologies become the fastest-growing segment of demand for most minerals, and their share of total demand edges up to over 40% for copper and rare earth elements (REEs), 60-70% for nickel and cobalt and almost 90% for lithium by 2040 in the SDS.
Mineral requirements for clean electricity
The IEA has identified copper, nickel, manganese, cobalt, chromium, molybdenum, zinc, rare earths and silicon as the essential minerals for a low-carbon future. The critical REEs are mainly neodymium, but also praseodymium, dysprosium and terbium. (In considering EVs the IEA adds lithium and graphite as critical.)
The US Department of Energy’s (DOE) Quadrennial Technology Review 20152 notes that certain materials are deemed ‘critical’ for power generation, though in small quantities. “Critical materials have important magnetic, catalytic, and luminescent properties, with applications in solar PV, wind turbines, electric vehicles and efficient lighting. Five rare earth metals (dysprosium, neodymium, terbium, europium, and yttrium), as well as indium, were assessed as most critical between 2010 and 2015. Four other rare earth elements, as well as gallium, tellurium, cobalt, and lithium, were also considered. Important factors include high demand, limited substitutes, political or regulatory risks in countries where critical materials are produced, lack of diversity in producers, and competing technology demand.”
The IEA report on The Role of Critical Minerals in Clean Energy Transitions notes that the types of mineral resources used vary by technology. Lithium, nickel, cobalt, manganese and graphite are crucial to battery performance, longevity and energy density. The demand for each of these increases hugely by 2040. Rare earth elements are essential for permanent magnets that are vital for wind turbines and EV motors and they show a very large increase in demand to 2040. “The shift to a clean energy system is set to drive a huge increase in the requirements for these minerals, meaning that the energy sector is emerging as a major force in mineral markets.” Nuclear power is shown to need mainly copper, nickel and chromium.
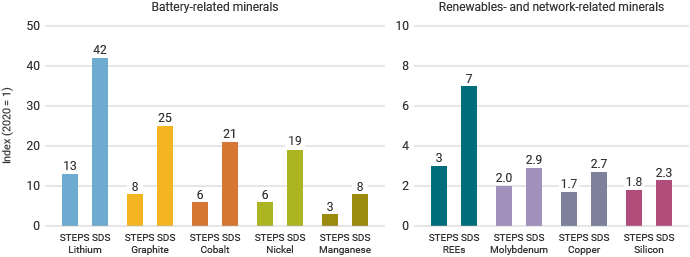
Figure 1: Growth in demand to 2040 for some critical minerals in IEA STEPS and SDS scenarios (source: IEA)
According to the IEA, per MW of capacity, offshore wind requires about 15.5 tonnes of critical minerals. Onshore wind is less mineral intensive, requiring about 10 t/MW, followed by solar photovoltaics (PV) at about 7 t/MW. The report notes that nuclear, along with hydropower and biomass, have comparatively low critical mineral requirements. High-carbon sources such as coal and gas require much less of those critical minerals.
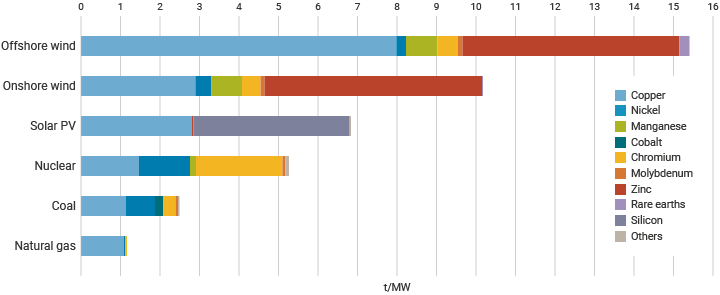
Figure 2: Critical minerals required for different generating technologies (source: IEA)
However, to get a meaningful ‘bottom line’ the distinction between the rated power of a system – its capacity – and the energy it actually produces must be considered. Using average capacity figures for each technology with the IEA estimates, the true relative critical mineral demand for each technology per unit of electricity delivered becomes clear.
| Plant t/MW | Indicative CF | TWh/yr | Operational lifetime (yrs) | Lifetime TWh | Plant t/TWh | |
|---|---|---|---|---|---|---|
| Coal | 2.5 | 85% | 7.5 | 50 | 375 | 7 |
| Nuclear | 5.3 | 85% | 7.5 | 60 | 450 | 12 |
| Gas | 1.2 | 60% | 5.2 | 30 | 156 | 8 |
| Solar | 6.8 | 25% | 2.2 | 25 | 55 | 124 |
| Onshore wind | 10.1 | 35% | 3.1 | 25 | 78 | 130 |
| Offshore wind | 15.5 | 35% | 3.1 | 25 | 78 | 200 |
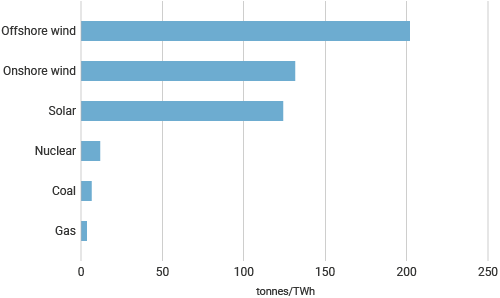
Table 1 and Figure 3: Critical minerals required per unit of electricity produced (source: IEA and World Nuclear Association analysis)
The IEA’s analysis excludes some common metals such as steel and aluminium, as well as concrete, all of which are key bulk materials widely used across many clean energy technologies. These minerals are less likely to experience supply disruptions given the ubiquity of their production, and arguably their mining and processing may generate smaller environmental impacts to obtain a given amount. They may also be less carbon intensive to extract and process than the critical energy transition minerals identified by the IEA. Nevertheless, the amounts used are much greater, and they must be taken into account to give a full sense of a technology’s material requirements.
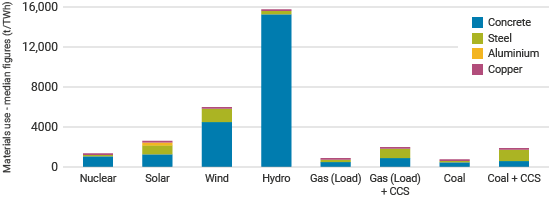
Estimates for the use of these key bulk materials and copper per TWh for different technologies have been produced by former environmental organization Bright New World, based on a literature review of studies on this topic3.
| Nuclear PWR | Solar | Wind | Hydro | Gas (load following) | Gas (load following) + CCS | Coal | Coal + CCS | |
|---|---|---|---|---|---|---|---|---|
| Concrete | 1060 | 1220 | 4470 | 15,320 | 390 | 820 | 450 |
520 |
| Steel | 130 | 940 | 1450 | 330 | 320 | 970 | 160 | 1170 |
| Aluminium | 0.3 | 287.5 | 17.4 | 8.7 | 5.7 | 21.4 | 1.6 | 37.4 |
| Copper | 2.5 | 68.0 | 39.1 | 4.8 | 5.4 | 8.8 | 3.0 | 11.8 |
| Capacity f. | 85% | 28% | 35% | 50% | 30% | 30% | 85% | 85% |
| Lifespan | 60 | 30 | 30 | 100 | 60 | 60 | 60 | 60 |
Table 2 and Figure 4: Major materials for different generating technologies, tonnes per TWh (source: Bright New World)
Older figures from the US DOE2 also show the high metals intensity of wind and solar.
| Coal | Gas CC | Nuclear PWR | Hydro | Wind | Solar PV | |
|---|---|---|---|---|---|---|
| Concrete & cement | 870 | 400 | 760 | 14,000 | 8000 | 4050 |
| Iron/steel | 310 | 170 | 165 | 67 | 1920 | 7900 |
| Copper | 1 | 0 | 3 | 1 | 23 | 850 |
| Aluminium | 3 | 1 | 0 | 0 | 35 | 680 |
| Glass | 0 | 0 | 0 | 0 | 92 | 2700 |
| Silicon | 0 | 0 | 0 | 0 | 0 | 57 |
| Total metals | 314 | 171 | 168 | 67 | 1978 | 9430 |
Table 3: Materials requirements for electricity generation technologies, tonnes per TWh (source: US DOE)
In addition to the materials inputs to each MW of generating capacity and TWh of delivered electricity, the energy inputs and energy return on investment (EROI)a need to be considered (see information page on Energy Return on Investment). The figures for intermittent renewables are very low. The production of pure silicon for solar PV requires large energy inputs and is said to account for most resource consumption in solar cell manufacture.
Mineral requirements for transmission
To transition to a world powered by low-carbon technologies, and especially those that are diffuse, electricity grids will need to undergo significant upgrade and expansion. Grid systems that have high levels of wind and solar penetration will need to be sized such that they can cope with peak supply from dispersed intermittent sources as well as meeting peak demand during periods when those assets are not producing electricity. They will also need to be able to store electricity to meet that demand reliably.
According to the IEA, there are over 70 million kilometres of transmission and distribution lines worldwide. It is estimated that some 150 Mt of copper and 210 Mt of aluminium are ‘locked in’ those electricity grids operating today.
Some 90% of the total length is distribution systems, traditionally used to deliver electricity to end users. Increasingly distribution systems are supporting the integration of residential solar PV and onshore wind capacity. In the SDS, global installation of utility-scale battery storage is set for a 25-fold increase from 2020 to 2040, with annual deployment reaching 105 GW by 2040, or 65 GW with STEPS (about 15.5 GW in total was connected at end of 2020).
Similarly, transmission systems, traditionally used to connect large hydro and thermal plants with centres of demand, have new roles to carry out as they now integrate large amounts of solar PV and wind (in particular offshore wind) capacity.
To connect countries, and to enable long-distance transmission, high-voltage direct current (HVDC) lines are increasingly used. According to the IEA, two-thirds of HVDC systems worldwide have been added in the past 10 years and greater use of these will reduce aluminium and copper demand slightly.
To expand electricity grids, large amounts of minerals and metals are required. Copper and aluminium are the principal material components in wires and cables. Copper is typically preferred due to its higher electrical conductivity, corrosion resistance and tensile strength. However, cost considerations, and the fact that copper is three times heavier than aluminium, mean the latter is often favoured for overhead lines, with copper utilized for underground and subsea cables.
The IEA’s STEPS suggests the requirement for new transmission and distribution lines will be 80% greater over the coming decade than the expansion seen in the last ten years. About 50% of the increase in transmission lines and 35% of the increase in the distribution network lines are directly attributable to increased deployment of intermittent renewable energy. In the SDS, the IEA projects over 3000 km of new and replacement grid capacity being built in 2030 and almost 6000 km in 2040, most of this being for distribution. It translates to 19 million tonnes of copper and aluminium in 2030 and 27 million tonnes in 2040, or 17 and 21 Mt respectively for the STEPS scenario, up from 14 Mt in 2020 (5 Mt copper, 9 Mt aluminium).
Other mineral requirements
Electric vehicles
The IEA considers copper, nickel, manganese cobalt, REEs, lithium and graphite as the minerals critical to an EV future. In general, the IEA says that building EVs requires six times the ‘critical’ mineral inputs of a conventional internal combustion engine (ICE) car, most of this being in the battery. To achieve global climate goals, the rapid electrification of private transport, as well as light commercial vehicles, buses and freight, is seen as essential and has become a contentious political imperative.
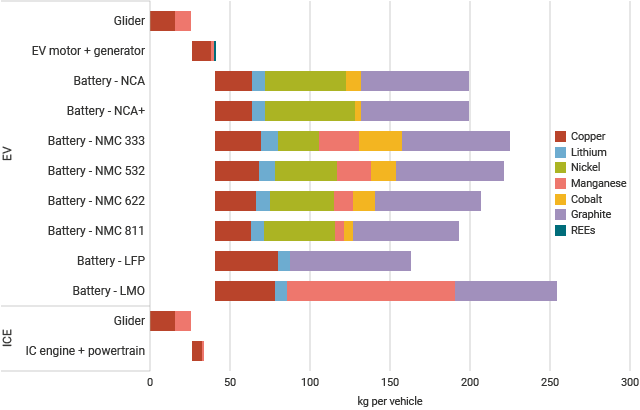
Figure 6: Critical minerals for an internal combustion engine (ICE) vehicle and a battery electric vehicle (source: IEA)
Lithium ion batteries may be categorized by the chemistry of their cathodes. Figure 6 shows the mineral use for lithium manganese oxide (LMO), lithium iron phosphate (LFP), lithium nickel cobalt aluminium oxide (NCA) and lithium nickel manganese cobalt oxide (NMC) batteries. The different combination of minerals gives rise to significantly different battery characteristics:
- NCA battery – specific energy range (200-250 Wh/kg), high specific power, lifetime 1000 to 1500 full cycles. Favoured in some premium EVs (e.g. Tesla), but more expensive than other chemistries.
- NMC battery – specific energy range (140-200 Wh/kg), lifetime 1000-2000 full cycles. Most common battery used in electric and plug in hybrid electric vehicles. Lower energy density than NCA, but longer lifetimes.
- LFP battery – specific energy range (90-140 Wh/kg), lifetime 2000 full cycles. Low specific energy a limitation for use in long-range EVs. Could be favoured for stationary energy storage applications, or vehicles where size and weight of battery are less important.
- LMO battery – specific energy range (100-140 Wh/kg), lifetime 1000-1500 cycles. Cobalt-free chemistry seen as an advantage. Used in electric bikes and some commercial vehicles.
The glider is a vehicle without motor and powertrain or generator.
Note that Figure 6 shows only ‘critical’ minerals, not steel, aluminium or tyres, which together make up most of a vehicle’s mass.
Hydrogen production
Electrolyzers to make hydrogen from electricity will be a major growth area for some minerals, depending on the type of electrolyzer. Figure 7 shows the mineral usage for various electrolyzers. For more information on hydrogen see information page on Hydrogen Production and Uses.
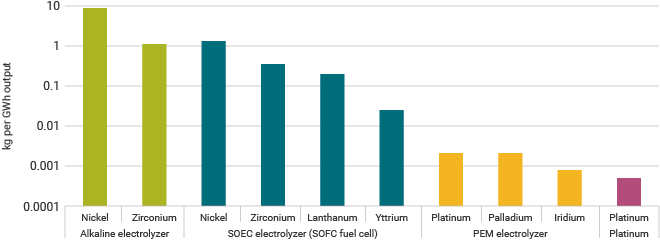
Figure 7: Electrolyzer mineral requirements (source: IEA)
Climate, environmental and social implications
Social implications
High-grade deposits of many critical minerals are concentrated in a relatively small number of countries. In many cases, these are developing countries that lack the environmental legislation required to minimize the adverse impacts of mining.4
Where mineral resources are not exploited responsibly, social impacts can be profound. Fatalities to workers, risks to the public, as well as human rights abuses, including the use of child labour, are issues in some countries that mine minerals to support the proliferation of clean energy technologies.5
Environmental implications
The increasing extractive and processing activities required for the deployment of intermittent renewables and other low-carbon technologies have significant environmental implications.
Mineral development affects local and regional environments in a number of ways. The IEA has identified three principal challenges that must be managed to mitigate negative impacts:
- Land use change – ecosystem impacts including loss of biodiversity and habitats home to endangered species, displacement of communities.
- Water use – increased use putting pressure on local sources with mines often in areas of existing water stress, contamination through discharge or tailings disposal.
- Waste generation – residues from production, potentially hazardous.
Such considerations are particularly important for REEs used in wind turbines, solar panels and EVs. Generally, the mining and processing of such minerals generates larger environmental impacts than bulk minerals such as steel and aluminium.
Forecasts of future mineral demand focus on the amounts of final, refined mineral or metal – not the amount of material moved and processed. For every unit of refined, purified product, a very much larger amount must be moved, extracted and processed. The key metric is ore grade: the proportion of a rock that contains the element(s) that are the target of extraction. For copper, the ore grade is typically about 0.5%, for example. So, to obtain a tonne of the element, roughly 200 tonnes of ore must be extracted, apart from any waste rock and overburden. For many of the critical minerals needed in clean energy technologies, ore grades are much lower. For cobalt, for example, roughly 1500 tonnes of ore must be mined and processed for each tonne of element recovered.
Whilst there is generally no shortage of minerals in the Earth’s crust, declining ore grade can have important environmental implications. For example, copper ore grade has declined such that, on average, mining now requires excavating twice as much ore as 10 years ago to yield the same amount of copper. Mining more ore increases energy use, hence usually greenhouse gas emissions, and tailings residues.
Recyling potential
Theoretically many of the mineral components of low-carbon or any other infrastructure can be recycled, preserving a valuable resource.
Recycling of steel, copper and aluminium is well-established, but less than 1% of lithium and rare earth metals are so far recycled.6 While most metals in wind turbines can be recycled, the blades are not economically recyclable. For solar PV units, recycling is possible but not economic. The IEA in its SDS projects over 1300 GWh (> 10 million tonnes) of spent lithium-ion batteries needing recycling by 2040, mostly from EV cars.
Whilst recycling holds potential to meet a significant proportion of demand for some minerals, there are significant challenges. Most obviously, minerals used to build low-carbon infrastructure will not be available for potential recycling for several decades, depending on the lifetime of the plant. According to the International Aluminium Institute, for example, 75% of the almost 1.5 billion tonnes of aluminium ever produced is still in productive use today.
However, the key challenge in recycling trace minerals is the same as the initial challenge in mining them – it depends on concentration. For many minerals used in low-carbon technologies, their concentration in waste streams precludes profitable or practical recycling. In many cases, the concentrations are lower than in the virgin ore from which the minerals were mined. Some metals’ applications are amenable to easy recovery (e.g. lead in batteries, steel in automobiles), whereas recycling materials used in small quantities in complex products is technically much more challenging. As such, it is often the case that the energy required to recover a recycled mineral is greater than the amount needed to extract it from virgin ore.
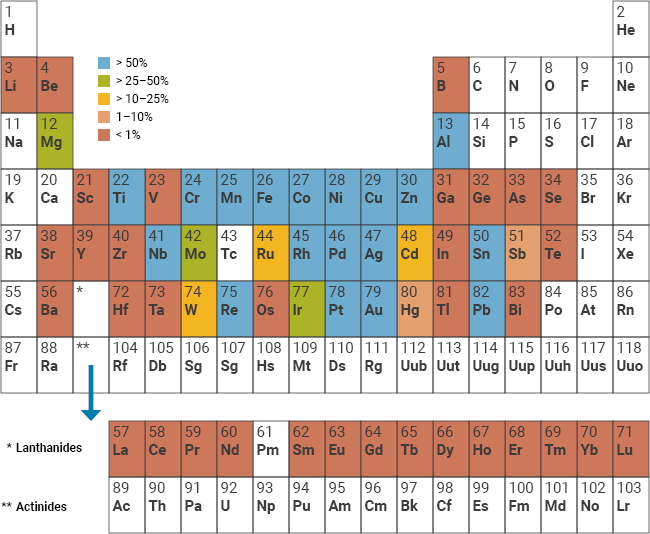
Figure 8: End of life recycling rates for 60 metals (source: United Nations Environment Programme)
Geopolitical considerations
The concept of ‘peak oil’ is well understood and is often cited as a reason – among others – for moving away from a fossil fuel powered economy. However, given the concentration of critical minerals in a small number of countries, and projected future demand relative to current production, it is likely that a move towards mineral-intensive energy technologies will compound rather than abate the geopolitics of energy.
As markets for key minerals grow rapidly, they are likely to be subject to the same price volatility, geopolitical influence and supply disruptions that have long-characterized oil and gas markets. In many ways, the risks of market tightness and price volatility are greater for many of the critical minerals than for oil and gas due to the consolidated nature of supply. For example, the Democratic Republic of Congo produced 70% of the world’s cobalt and China 60% of the world’s REEs in 2019. Processing operations are more concentrated, with China refining 50-70% of the world’s supply of lithium and cobalt, and 90% of its REEs.
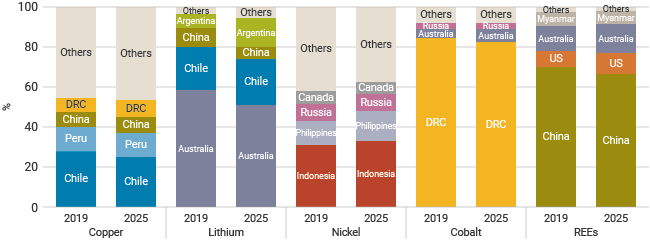
Figure 9: Sources of some critical minerals (source: IEA)
The IEA’s report on The Role of Critical Minerals in Clean Energy Transitions notes that countries need to make sure their energy systems remain resilient and secure as they increase efforts to reduce emissions. “Today’s international energy security mechanisms are designed to provide insurance against the risks of disruptions or price spikes in supplies of hydrocarbons, particularly oil. Minerals offer a different and distinct set of challenges, but their rising importance in a decarbonizing energy system requires energy policymakers to expand their horizons and consider potential new vulnerabilities. Concerns about price volatility and security of supply do not disappear in an electrified, renewables-rich energy system”
Notes & references
Notes
a. The energy return on investment (EROI) is defined as the ratio of the amount of energy delivered to society in the form of a useful energy carrier by a chain of processes exploting a primary energy source to the total energy 'invested' in finding, extracting, processing and delivery that energy. [Back]
References
1. World Bank, The Growing Role of Minerals and Metals for a Low Carbon Future (June 2017) [Back]
2. US DOE, Quadrennial Technology Review - An Assessment of Energy Technologies and Research Opportunities (September 2015) [Back]
3. Bright New World, Materials use in a clean energy future (June 2021) [Back]
4. Yale Environment 360, China Wrestles with the Toxic Aftermath of Rare Earth Mining (July 2019) [Back]
5. Center for Effective Global Action, Artisanal Mining, Livelihoods, and Child Labor in the Cobalt Supply Chain of the Democratic Republic of Congo (May 2017) [Back]
6. United Nations Environment Programme, Recycling Rates of Metals (2011) [Back]
General sources
IEA, The Role of Critical Minerals in Clean Energy Transitions (May 2021)
Carbon Brief, Explainer: These six metals are key to a low-carbon future (April 2018)
Michael F. Ashby, Materials and the Environment (2013)
Florian Fizaine and Victor Court, Renewable electricitry producing technologies and metal depletion: A sensitivity analysis using the EROI (December 2015)
Iñigo Capellán-Pérez, Carlos de Castro and Luis Javier Miguel González, Dynamic Energy Return on Energy Investment (EROI) and material requirements in scenarios of global transition to renewable energies (November 2019)
D.Weißbach et al., Energy intensities, EROIs (energy returned on invested), and energy payback times of electricity generating power plants (April 2013)
Related information
Nuclear Energy and Sustainable DevelopmentEnergy Return on Investment
Nuclear Power and Energy Security