Appendix 2: Nuclear capacity or generation in energy scenarios
Several international organizations have developed global energy scenarios that provide different possible versions of the future. Those scenarios that are net-zero or 1.5-degree-aligned have been developed to reflect the increasingly urgent requirement of achieving the 1.5 °C goal of the Paris Agreement. The scenarios provide information and policy implications regarding future energy systems to governments and businesses and can strongly influence their energy strategies.
While almost all climate mitigation scenarios include nuclear in their analysis and acknowledge the continuous role that nuclear should play in the future, the specific method and results for nuclear energy are various. This appendix reviews the future of nuclear energy under major energy scenariosf, compares their results against the Declaration to Triple Nuclear Energy and the results from this report.
A2.1 Summary of selected energy scenarios
A2.1.1 IEA Net Zero Emissions by 2050 Scenario
The International Energy Agency (IEA) develops and updates three scenarios using its Global Energy and Climate (GEC) Model: the Stated Policies Scenario (STEPS), the Announced Pledges Scenario (APS) and the Net Zero Emissions by 2050 Scenario (NZE). These scenarios are frequently referred to by policymakers, the media, and analysts, and underpin the IEA’s flagship annual publication, the World Energy Outlook (WEO).278
The STEPS extrapolates existing policies that are in place and under development. The APS assumes that all climate commitments, including net-zero targets, made by governments and industries will be met in full and on time. Both the STEPS and APS are exploratory scenarios, which do not
target a specific outcome but rather establish sets of starting conditions and consider where they may lead. In contrast, the NZE is a normative scenario, which shows a pathway to achieve defined outcomes – such as reaching net zero carbon emissions by 2050. The STEPS, APS and NZE are associated with temperature rises of 2.4 °C, 1.7 °C and 1.5 °C (with a 50% probability), respectively.
In the 2024 edition of WEO, the IEA projects significant nuclear growth under the NZE where gross nuclear power capacity grows from 416 GWe in 2023 to 1017 GWe by 2050. Nuclear capacity in 2050 in the STEPS and APS is 647 GWe and 874 GWe, respectively. Notably, in all scenarios nuclear contributes to roughly 7-9% of total electricity generation, which is slightly lower than the 2023 level (9.3%), while the share of renewables surges from 30% to 73-88%; hydrogen, ammonia, as well as fossil fuels with CCUS, also play more significant roles in power generation.
Table A2.1 : Nuclear power capacity, nuclear electricity generation and share in total generation in WEO 2024279,280
|
Scenario |
2023 (GWe) |
2030 (GWe) |
2040 (GWe) |
2050 (GWe) |
Nuclear electricity generation in 2050 (TWh) |
Share of total generation in 2050 |
|---|---|---|---|---|---|---|
|
STEPS |
416 |
478 |
557 |
647 |
4460 |
7.6% |
|
APS |
416 |
508 |
748 |
874 |
6055 |
8.6% |
|
NZE |
416 |
554 |
896 |
1017 |
6969 |
8.7% |
In the GEC Model, the operating lifetimes of nuclear reactors are assumed to be 45-60 years, unless otherwise specified. Other factors that might affect the analysis include a lack of consideration of non-electricity nuclear applications, namely nuclear for hydrogen or industrial process heat, as well as not including advanced reactors in the mid-to-long term.
From the policy and regulatory perspective, the IEA notes that compared with other sources of generation, additions of nuclear power capacity are more affected by government policies.
Finally, energy savings and efficiency improvements might be assumed to a degree that compromises the NZE’s plausibility. The 2050 global energy supply per capita is reduced by 28% compared with the 2023 level, which would be highly ambitious within the context of global economic growth especially from emerging markets during this period. The overall low energy demand projection contributes to a lower 2050 nuclear capacity result.
A2.1.2 Shell: The 2025 Energy Security Scenarios
Shell regularly publishes energy scenarios based on its own World Energy Model (WEM). In its publication titled The 2025 Energy Security Scenarios, Shell presented three energy scenarios to 2050: Archipelagos, which envisions a world that focuses on short-term national border and resource security; Surge, which features stronger economic growth, mainly driven by boosting AI technologies; and Horizon, which is defined as realizing net-zero emissions by 2050 and achieving 1.5 °C target281.
In Horizon, nuclear grid power capacity grows to 494 GWe in 2040 and slightly declines from then to 479 GWe in 2050. The share of nuclear in total electricity consumption in Horizon is 4.5% in 2050, less than half of the 2023 level. It is worth noting that apart from grid electricity generation, the report also provides projections for nuclear capacity used for power-to-liquids (liquid hydrocarbon fuels), and hydrogen productiong, which in Horizon amounts to 34 GWe and 108 GWe, respectively.
While its dataset does not distinguish between large-scale reactors and SMRs, Shell emphasizes the role of SMRs in Horizon and Surge. The latter projects SMRs to ramp up in the 2040s to meet the demand from data centres but also industrial electric furnaces and ships. This does not lead to a larger nuclear capacity in 2050 compared with 2025, but in the longer-term Surge indicates 1157 GWe nuclear capacity (including non-electricity capacity) in 2100. The nuclear capacity in Horizon in 2100 (1166 GWe) is very close to Surge, but with more capacity in generating hydrogen and less capacity in power-to-liquids and power generation.
The WEM used by Shell is similar to the IEA GEC model in the sense that they both generate economic pathways to meet a calculated energy demand but not the least cost pathways, as technical and political factors are also considered282. There are unique characteristics of the WEM that might affect its nuclear projection. WEM explicitly mentioned that it applies annual deployment rate constraints at a country level for nuclear and renewable sources, and assumptions concerning public acceptance, energy security and safety consideration predominate the constraints for nuclear growth283.
Table A2.2 Nuclear power capacity, nuclear electricity generation and share in total generation in Shell scenarios
|
Scenario |
2025 (GWe) |
2030 (GWe) |
2040 (GWe) |
2050 (GWe) |
Nuclear electricity consumption in 2050 (TWh) |
Share in total electricity consumption in 2050 |
|---|---|---|---|---|---|---|
|
Archipelagos |
456 |
480 |
446 |
390 |
1897 |
3.5% |
|
Surge |
456 |
480 |
435 |
429 |
2292 |
3.3% |
|
Horizon |
457 |
489 |
494 |
479 |
2669 |
4.5% |
A2.1.3 BP Net Zero and Equinor Bridges scenarios
BP and Equinor both have scenarios – namely BP's Net Zero scenario283 and Equinor's Bridges scenario284 – that are broadly consistent with the Paris Agreement climate goals.h
Although their data disclosures are less detailed than those of Shell, and do not include generation capacity figures, they do provide their visions of the future amount of nuclear energy consumption. In BP's Net Zero scenario, nuclear electricity generation increases by 117% from 2680 TWh in 2022 to 5820 TWh in 2050, accounting for 8.4% of total generation in 2050. Equinor's Bridges scenario depicts nuclear generation to increase by 74% from 2676 TWh in 2020 to 4647 TWh in 2040, but then decline to 3655 TWh in 2050, accounting for 7.3% of total generation in that year – which is lower than the nuclear generation in 2050 (4529 TWh) under the Equinor’s reference scenario Walls.
Both scenarios project significantly less total electricity generation in 2050 (68,970 TWh and 49,889 TWh) compared with the IEA's NZE (80,194 TWh).
Table A2.3 Nuclear electricity generation and share in total generation in BP's Net Zero scenario and Equinor's Bridges scenario
|
Scenario |
2020 (TWh) |
2030 (TWh) |
2040 (TWh) |
2050 (TWh) |
Share in total electricity generation in 2050 |
|---|---|---|---|---|---|
|
BP Net Zero |
2690 |
3270 |
4550 |
5820 |
8.4% |
|
Equinor Bridges |
2676 |
3781 |
4647 |
3655 |
7.3% |
A2.1.4 Bloomberg NEF Net Zero Scenario
Bloomberg NEF’s New Energy Outlook 2025 encompasses two scenarios: Economic Transition Scenario (ETS), and Net Zero Scenario (NZS, which aims to achieve net zero emissions by 2050). In its Net Zero Scenario installed nuclear electric capacity reaches 1085 GWe in 2050, and generation from nuclear is 8146 TWh, accounting for 9.4% of total electricity generation. The results are close to the IEA’s NZE figures for nuclear285.
Table A2.4: Nuclear power capacity, nuclear electricity generation and share in total generation in New Energy Outlook 2025.
|
Scenario |
2025 (GWe) |
2030 (GWe) |
2040 (GWe) |
2050 (GWe) |
Nuclear electricity generation in 2050 (TWh) |
Share in total generation in 2050 |
|---|---|---|---|---|---|---|
|
ETS |
393 |
424 |
500 |
505 |
3780 |
7.1% |
|
NZS |
397 |
570 |
974 |
1085 |
8146 |
9.4% |
A2.1.5 IAEA Reference Data Series No. 1 (RDS-1)
The International Atomic Energy Agency (IAEA) provides its projections of energy, electricity and nuclear power up to 2050 in its annual publication Reference Data Series No. 1 (RDS-1), Energy, Electricity and Nuclear Power Estimates for the Period up to 2050.286 Two scenarios are considered, with the Low Case assuming the continuation of current trends and the High Case being more ambitious, with stronger national policies to expand nuclear and enabling factors in place. As an exploratory scenario it does not explicitly adhere to any climate targets such as net zero emissions by 2050 or constrain the rise in average global temperature below 1.5 °C or 2 °C. Nevertheless, the High Case provides a view of future nuclear power under stronger climate policies.
The IAEA projects 514 GWe of nuclear capacity in the Low Case and 950 GWe in the High Case by 2050. The share of nuclear in the total electricity mix would be 6.9% and 12.8% in 2050 in the Low and High Cases, respectively. SMRs would account for 24% of the capacity added by 2050 in the High Case and 6% of the capacity added in the Low Case.
The scenarios are calculated under the same total energy and electricity demand estimation, which is generated by IAEA’s Model for Analysis of Energy Demand (MAED). The nuclear projections are generated mainly based on external experts’ inputs in the IAEA’s annual Consultancy Meeting on Nuclear Capacity Projections up to 2050, which takes a country-by-country, project-by-project ‘bottom-up’ (i.e. exploratory) approach, considers all operating reactors, possible licence renewals, planned shutdowns and plausible construction projects for the next few decades and builds the estimates for both cases.
Table A2.5: Net nuclear power capacity, nuclear electricity generation) and share in total generation in IAEA RDS-1
|
Scenario |
2023 (GWe) |
2030 (GWe) |
2040 (GWe) |
2050 (GWe) |
Nuclear electricity generation in 2050 (TWh) |
Share in total generation in 2050 |
|---|---|---|---|---|---|---|
|
Low Case |
372 |
414 |
491 |
514 |
4157 |
6.9% |
|
High Case |
372 |
461 |
694 |
950 |
7666 |
12.8% |
A2.1.6 UNECE Carbon Neutrality and Carbon Neutrality Innovation Scenarios
The United Nations Economic Commission for Europe (UNECE) Carbon Neutrality in the UNECE Region: Technology Interplay under the Carbon Neutrality Concept report uses three scenarios to illustrate possible versions of the future of the UNECE regioni: Reference Scenario; Carbon Neutrality Scenario, which uses the same technology, innovation, and infrastructure assumptions as the Reference Scenario but imposes a carbon neutrality constraint by 2050; and Carbon Neutrality Innovation Scenario, which applies different technology assumptions on carbon capture, use and storage (CCUS), nuclear power, as well as hydrogen, driven by innovation and policies that accelerate the uptake of innovative technologies.
In contrast to the significantly reduced nuclear role in the Reference Scenario, nuclear capacity in the Carbon Neutrality Scenario would reach 604 GWe in the UNECE region in 2050, generating 4400 TWh, account for around 20% of total electricity generation.
Under the Carbon Neutrality Innovation Scenario – where SMRs are assumed to have the same capital costs as large reactors but they have much shorter construction times and are capable of operating more flexibly – nuclear capacity reaches 874 GWe in the UNECE region in 2050, generating 6235 TWh, around 28% of total electricity mix. SMRs would contribute to 454 GWe of the total capacity in 2050, a greater amount than from large reactors (420 GWe).
Table A2.6: Nuclear power capacity, nuclear electricity generation and share in total generation in UNECE analysis
|
Scenario |
2025 (GWe) |
2030 (GWe) |
2040 (GWe) |
2050 (GWe) |
Nuclear electricity generation in 2050 (TWh) |
Share in total generation in 2050 |
|---|---|---|---|---|---|---|
|
Carbon Neutrality |
604 |
4400 |
20% |
|||
|
Carbon Neutrality Innovation |
340 |
449 |
636 |
874 |
6235 |
28% |
A2.1.7 IPCC Sixth Assessment Report
The Intergovernmental Panel on Climate Change (IPCC) Sixth Assessment Report (AR6), published in 2022, includes extensive analysis of global emissions trajectories and mitigation pathways.287 The IPCC assesses several scenarios from the scientific literature, many of which are generated using integrated assessment models (IAMs).288 These scenarios explore how policy, technology, and societal choices can align with various long-term temperature goals, including the 1.5 °C and 2 °C targets under the Paris Agreement.
Regarding nuclear energy, the AR6 confirms its role as a low-carbon supply option in many mitigation scenarios. However, the pathways vary significantly depending on regional context, societal preferences, and assumptions regarding cost and policy feasibility. Among all AR6 scenarios categorized
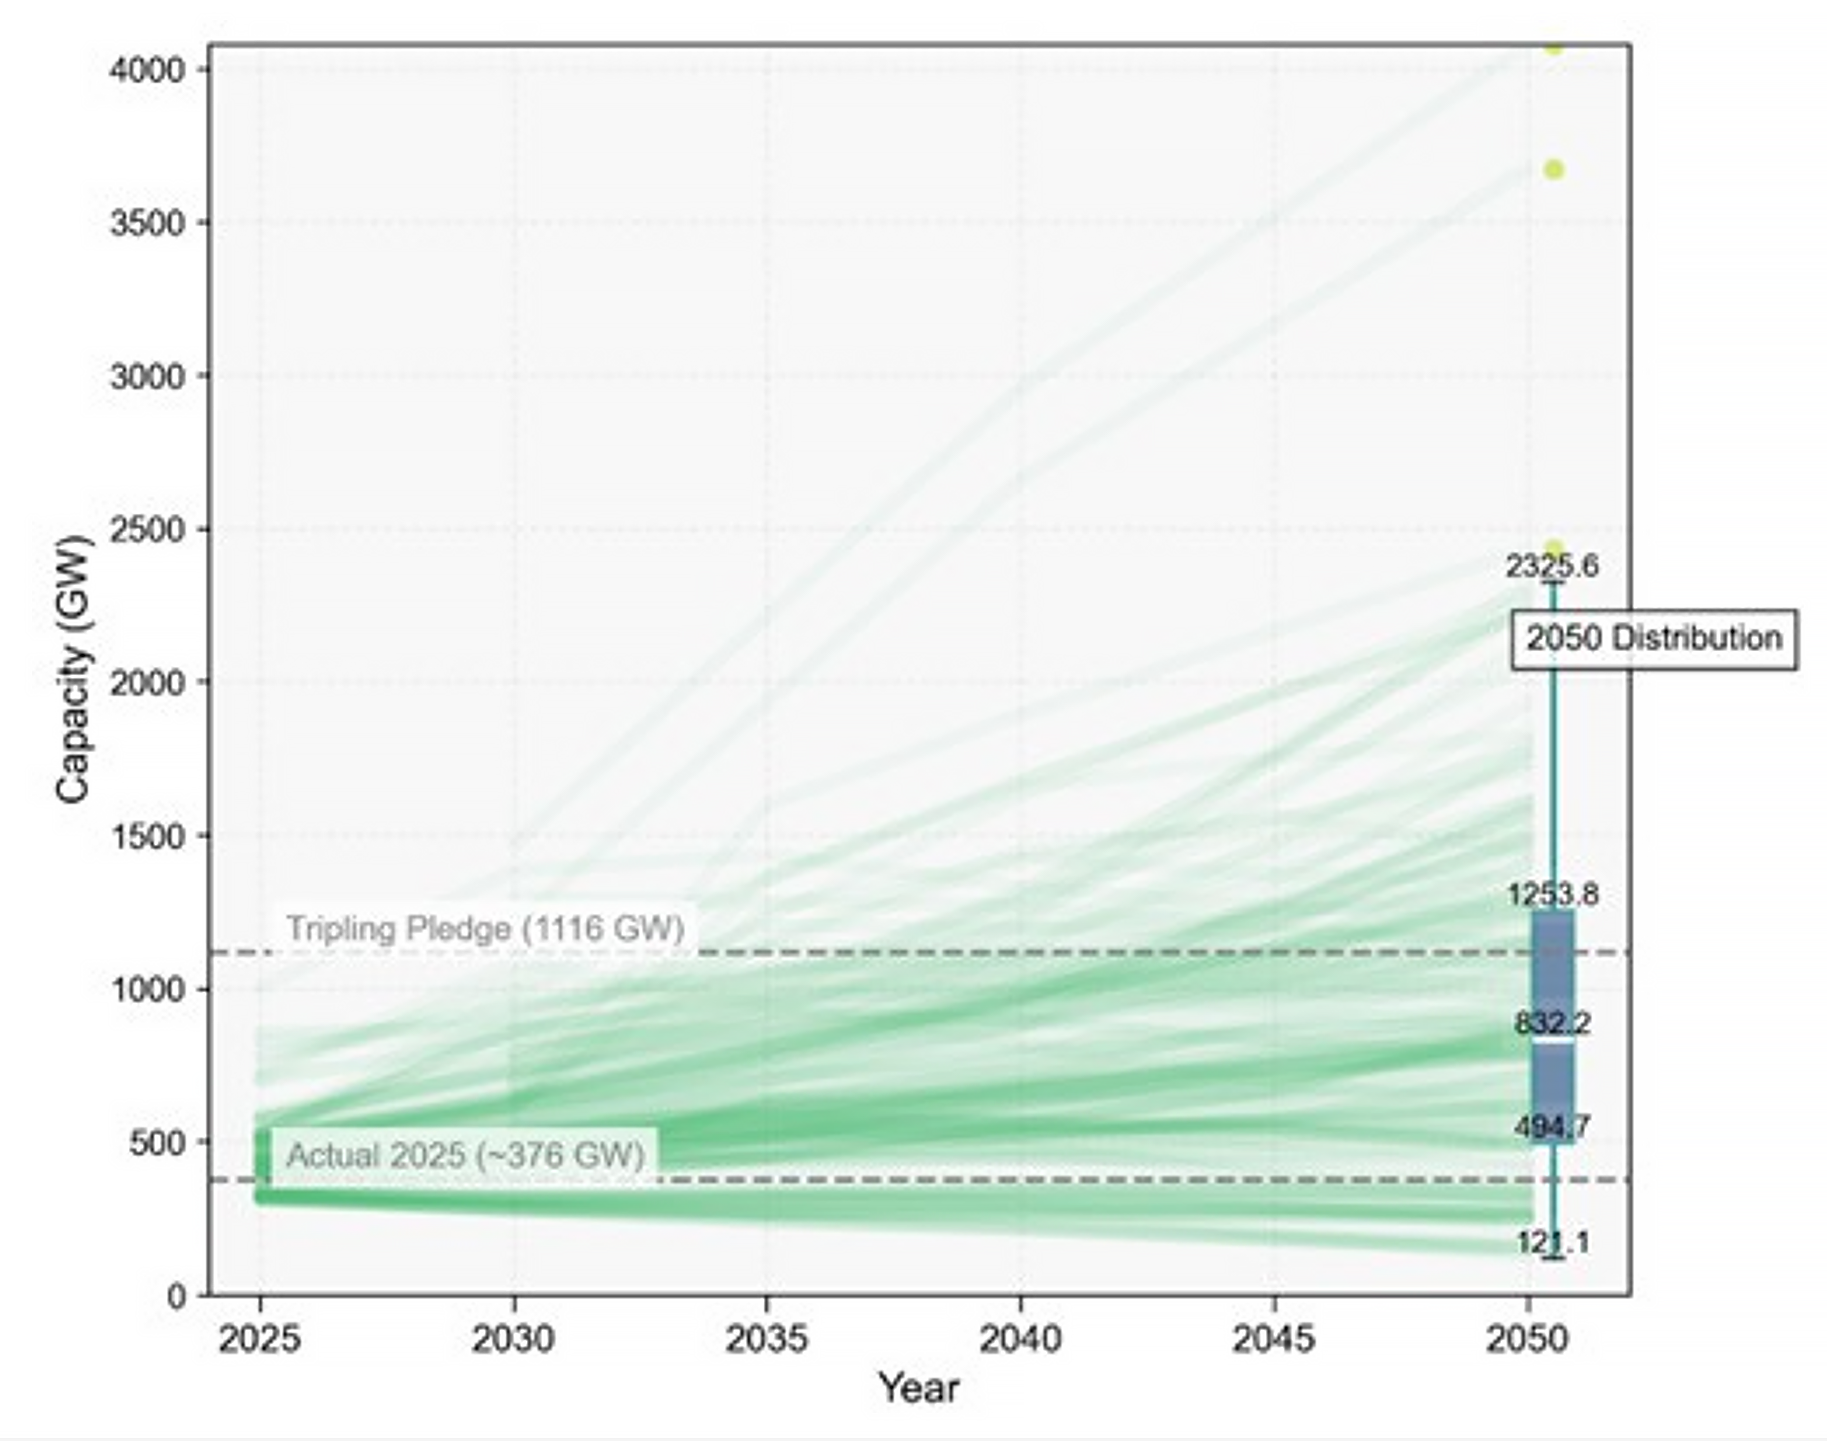
Figure A2.1: Nuclear capacity pathways 2025-2050 (IPCC AR6 C1&C2 scenarios)
A2.2 Comparative analysis of the scenarios and WNO 2025 results
Within energy scenario modelling, nuclear prospects are highly dependent on two main factors:) cost or economic factors; and policy or societal factors. From the cost perspective, in scenarios that disclose their techno-economic assumptions (such as the IEA World Energy Outlook and NGFS scenarios), the levelized cost of electricity (LCOE) for nuclear – particularly in North America and Europe – is set at relatively high levels, largely due to elevated capital costs. The projected LCOE for nuclear shows little to no decline over time towards 2050 (i.e. the assumed learning rate is very low). Interestingly, the difference in nuclear cost assumptions between baseline and net-zero scenarios is often minimal. In contrast, net-zero scenarios assume much more significant cost reductions for other low-carbon generation technologies, including solar PV, onshore and offshore wind, and fossil fuels with CCUS.
At the same time, the LCOE fails to capture system-level costs incurred by integrating new plants into the grid. This can lead to an underestimation of the system costs of variable renewables, and in turn, a diminished economic competitiveness for dispatchable sources such as nuclear.
From a policy standpoint, some of the top-down (i.e. normative) studies reviewed here – including the IEA World Energy Outlook and Shell scenarios – mention non-cost-related policy or societal limitations that restrict the scale-up of nuclear energy. For example, in their methodological notes, these reports often take into consideration that nuclear development is more heavily influenced by policy and public acceptance than other technologies. Shell applies a limit in its model on the annual deployment rate of nuclear power.
The various scenarios provide a large range of projections for nuclear capacity in 2050, from 271 GWe to 1085 GWe, even those with similar climate targets (i.e. limiting the increase in average global temperatures to 1.5 °C or achieving net-zero emissions by 2050).
Figure A2.2: Compilation of global scenarios with capacity projections
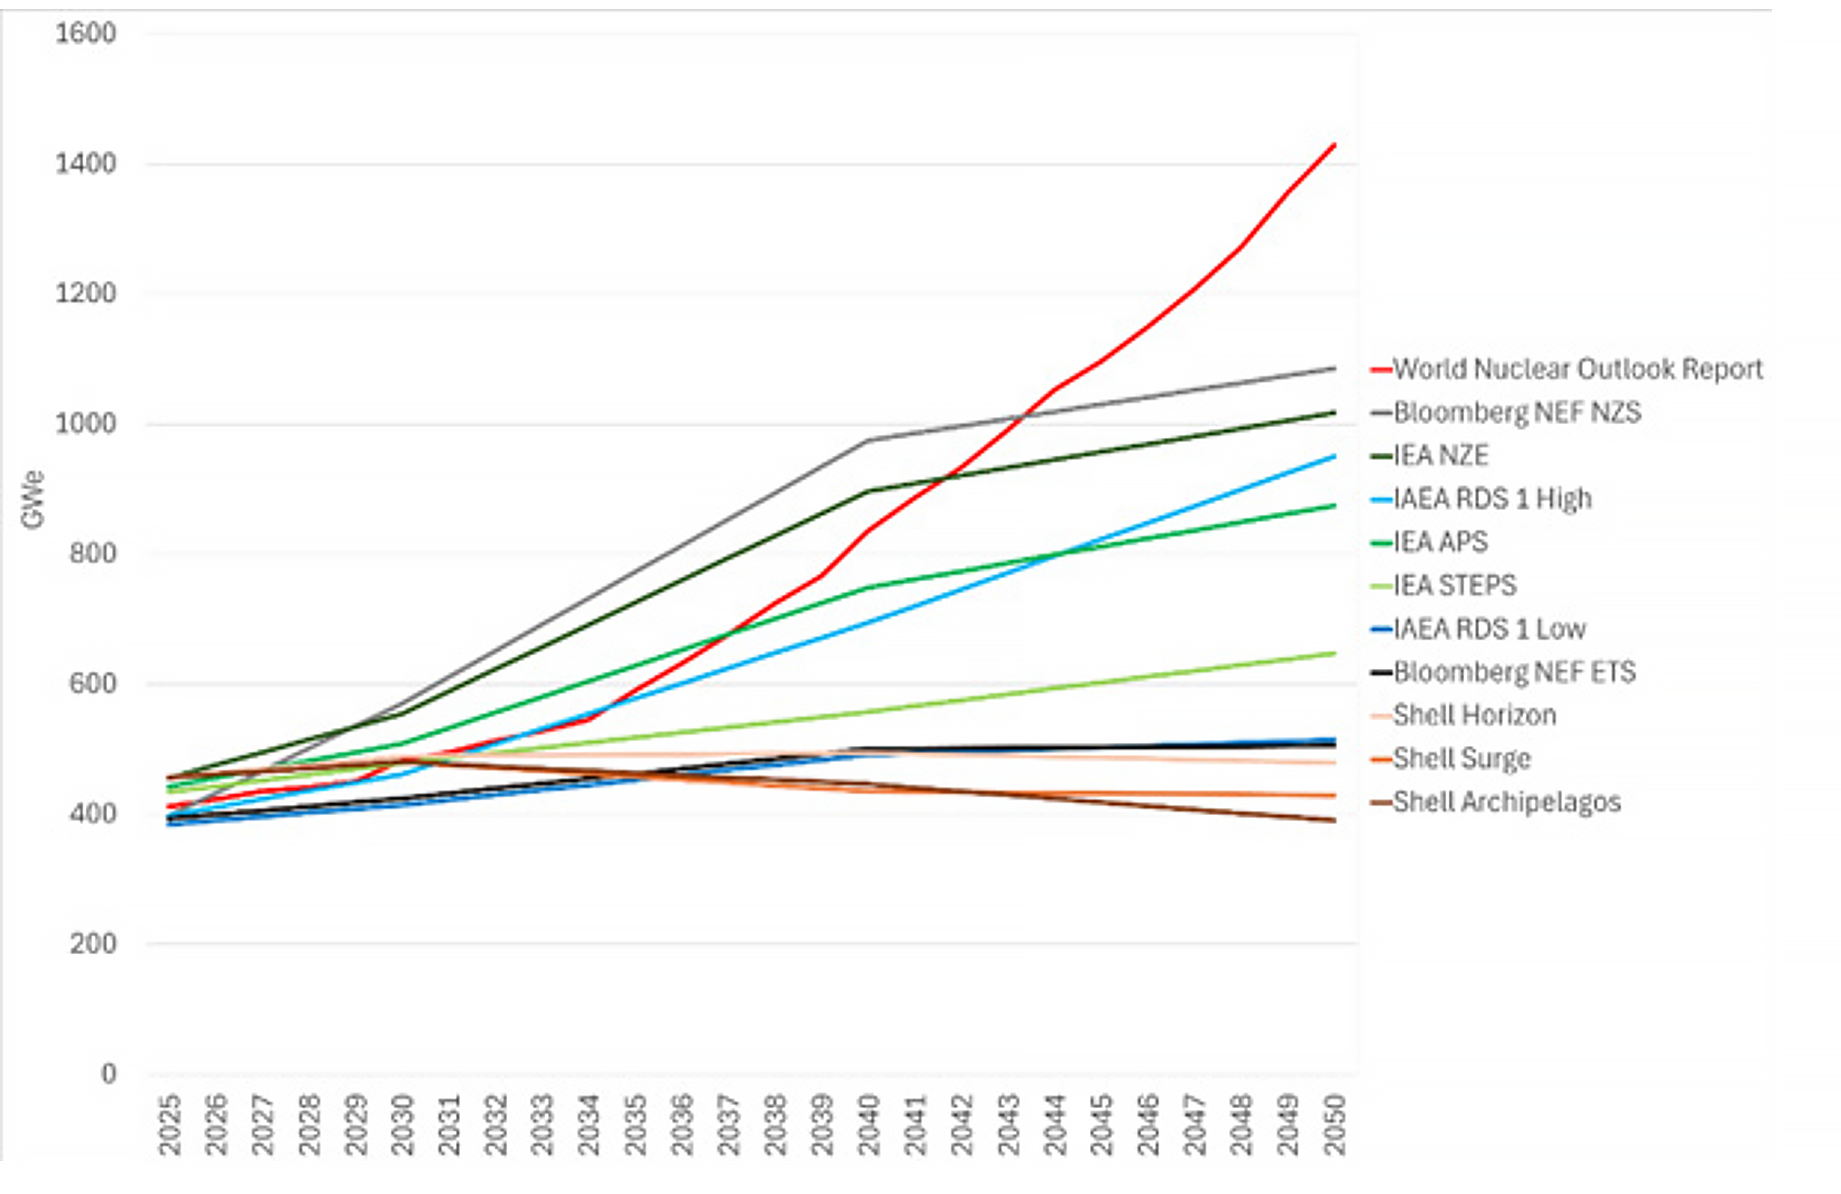
From the perspective of nuclear growth, the scenarios discussed in this Appendix can be classified into two broad categories. The first category includes scenarios that show nuclear capacity at least doubling (i.e. exceeding 800 GWe) between 2020 and 2050. This category includes Bloomberg NEF NZS, IEA NZE and IEA APS, as well as the IAEA RDS-1 High Case.
The second category of scenarios, which includes the scenarios of Shell, IEA STEPS, and Bloomberg NEF ETS, as well as the IAEA RDS-1 Low Case, are characterized by a more moderate increase in nuclear capacity, or even a decline.
Those scenarios with the highest nuclear capacities, Bloomberg NEF NZS and IEA NZE, are both designed to achieve net-zero emissions. The next highest nuclear capacity scenario is the IEA APS scenario, which includes policies that have been announced by government that have the objective of reducing emissions, although they are estimated not to be sufficient to achieve it.
Of those scenarios with lower nuclear capacity, two of the three Shell scenarios (Archipelagos and Surge) and the Bloomberg NEF ETS are not designed to achieve net-zero, The Shell Horizon scenario is designed, achieve net zero emissions does have only a modest increase in nuclear capacity to 2050.
However, subsequently, both the Horizon and Surge scenarios see nuclear capacity increasing, both reaching more than 1150 GWe by 2100.
The capacities projected for the scenarios reviewed in this appendix all fall short of both the objectives of the Declaration to Triple Nuclear Energy, and the total capacity projected by the country-by-country reviews in this document. However, the ranges of the projections of the IAEA RDS-1 and the scenarios set out in the World Nuclear Association Fuel Report encompass much of the variations in nuclear capacity projected by the scenarios described in this appendix.
For governments to meet the capacity goals set out in this document will require multiple actions on policy, regulation and financing, as well as a substantial increases in the capacity of the nuclear supply chain and fuel cycle services.
Footnotes
f The scenarios are chosen based on their extent of relevance to nuclear, data availability, as well as influence.
g For power-to-liquids and hydrogen, the figures represent the GW of electricity capacity needed as input to produce the energy carrier.
h While Equinor’s Bridges is compliant with 1.5°C target, bp stated that its Net Zero scenario cannot be compared directly with the COP21 Paris Agreement climate goals, as it does not include all GHGs or all sectors of the economy. By an indirect inference, bp concluded that CO2e emissions from its Net Zero scenarios are broadly in the middle of the ranges between IPCC 1.5 °C pathways and 2 °C pathways.
i UNECE regions include 56 countries, see: https://unece.org/member-states as ‘C1’ or ‘C2’, which implies a pathway in alignment with limiting warming to 1.5°C (with a greater than 50% probability), with no or limited overshoot (C1), or high overshoot (C2). (The overshoot refers to the extent to which global average temperatures exceed the target 1.5°C increase, before returning to 1.5°C or below by 2100.289) In these scenarios nuclear capacity in 2050 ranges from 121 GWe to over 2000 GWe, with a median of 832 GWe, lower quartile of 495 GWe and upper quartile of 1254 GWe. Around 80% of 1.5°C-target-aligned scenarios project an expansion of nuclear capacity, and 31% envisage nuclear capacity to be more than triple by 2050 (see Figure A2.1).