Global Nuclear Industry Performance
Global Highlights
Nuclear reactors generated a total of 2667 TWh of electricity in 2024, up 66 TWh from 2601 TWh in 2023. This is the highest ever generation from nuclear in one year, surpassing the previous record of 2660 TWh in 2006.
Figure 1. Global nuclear electricity production
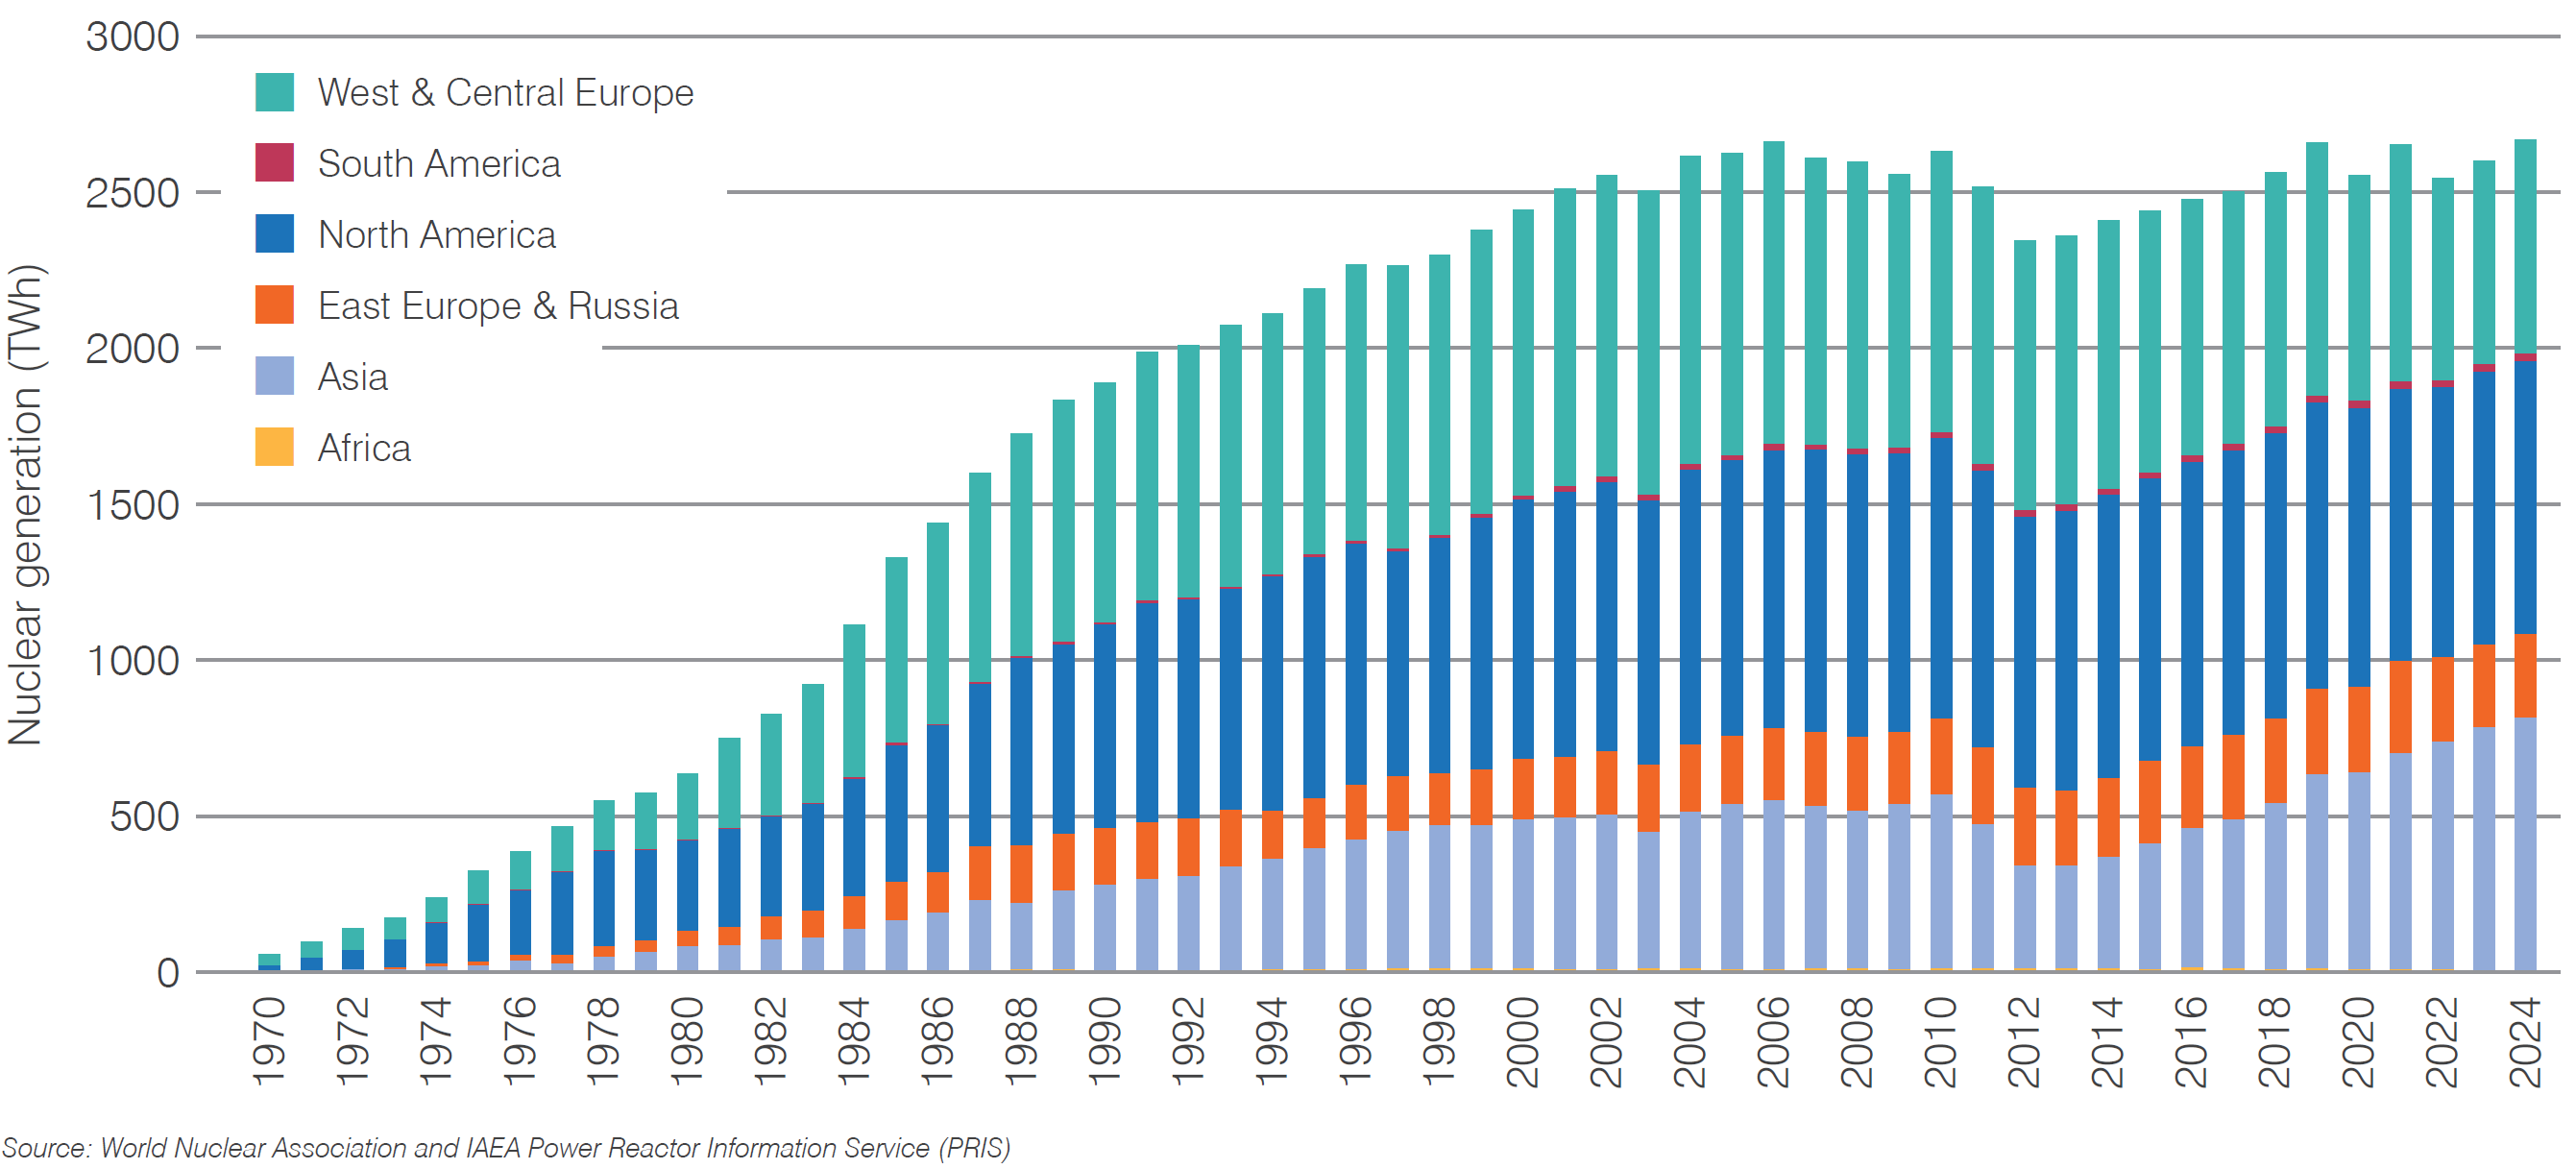
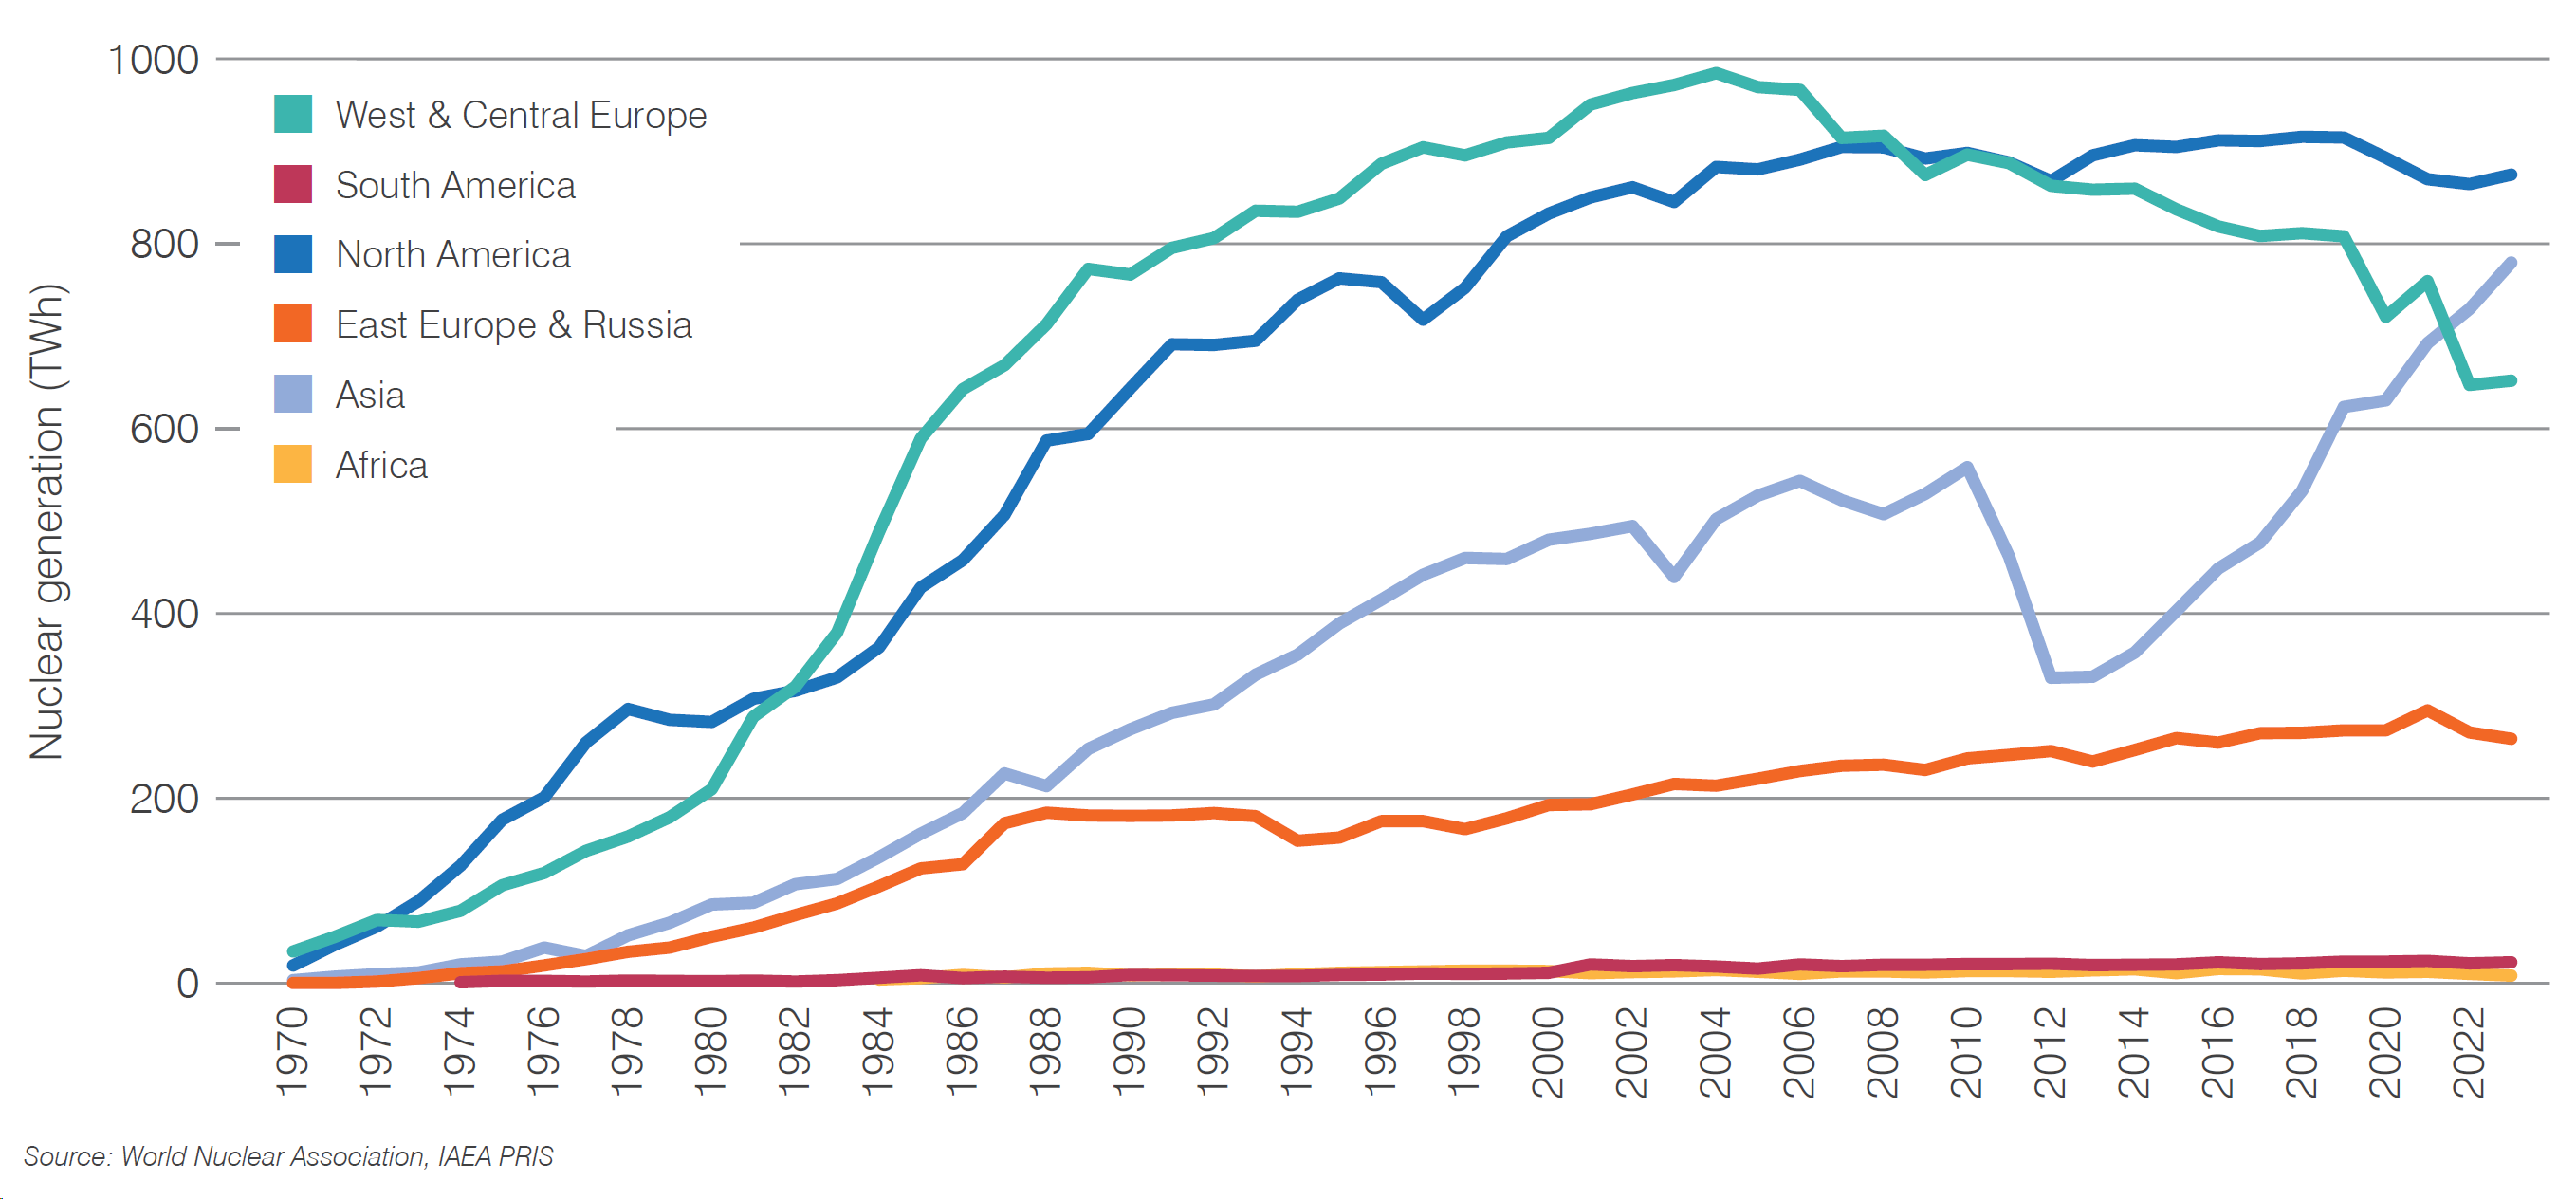
Generation increased in Asia, with five of the seven reactors connected to the grid in 2024 being located in that region. Generation also increased in West & Central Europe, with the return to service of reactors in France following outages in 2022 and 2023 contributing to this. In other regions, total generation in 2024 was broadly similar to the previous year.
Figure 2.Nuclear electricity generated by region
In 2024 the end-of-year capacity of operable nuclear power plants was 398 GWe, up 6 GWe on the 392 GWe at the end of 2023. This includes 19 GWe of capacity in Japan and less than 1 GWe capacity in India where the status is categorized as 'Suspended Operation' by the International Atomic Energy Agency (IAEA).
The total number of operable reactors at the end of 2024 was 440, up three from the previous year.
Table 1. Operable nuclear power reactors at year-end 2024 (change from 2023)
| Africa | Asia | East Europe & Russia |
North America |
South America |
West & Central Europe |
Total | |
|---|---|---|---|---|---|---|---|
| BWR | 19 | 33 | 8 | 60 | |||
| FNR | 2 | 2 | |||||
| GCR | 8 | 8 | |||||
| HTGR | 1 | 1 | |||||
| LWGR | 10 (-1) | 10 (-1) | |||||
| PHWR | 24 (+1) | 17 (-2) | 3 | 2 | 46 (-1) | ||
| PWR | 2 | 109 (+3) | 41 | 63 (+1) | 2 | 96 (+1) | 313 (+5) |
| Total | 2 | 153 (+4) | 53 (-1) | 113 (-1) | 5 | 114 (+1) | 440 (+3) |
The total capacity of reactors that produced electricity in 2024 was 369 GWe, up 1 GWe on the 2023 total. In addition to the 20 GWe of offline reactor capacity in Japan and India, a further 11 GWe of operable reactors did not produce electricity in 2024. The six reactors at Zaporizhzhia in Ukraine comprise nearly 6 GWe of this.
Figure 3. Status of operable nuclear capacity
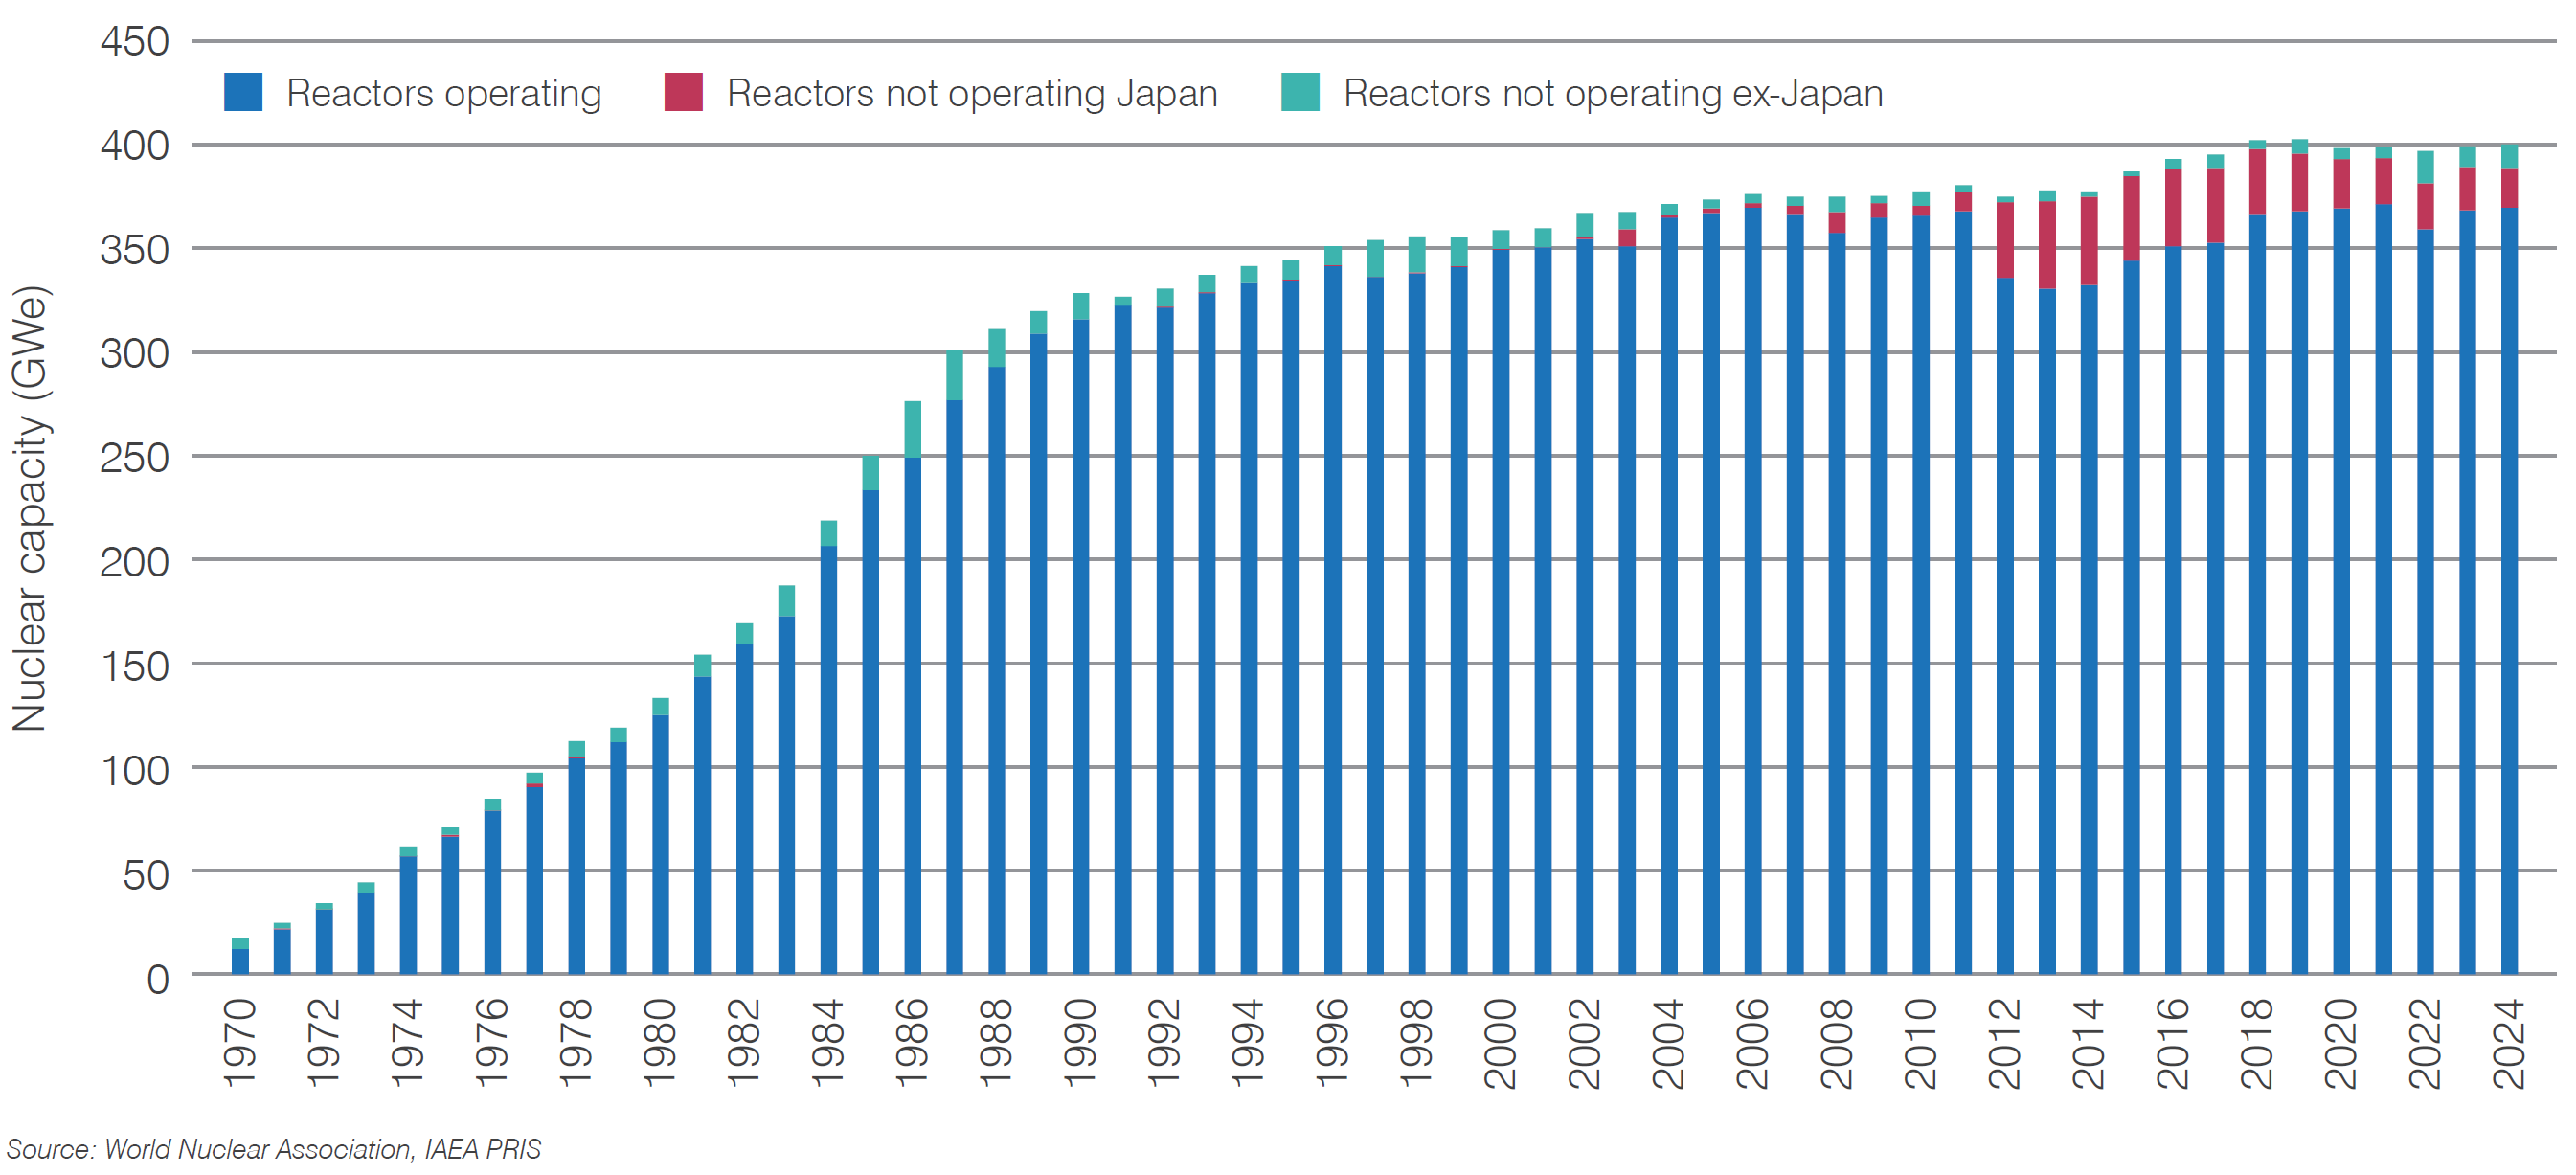
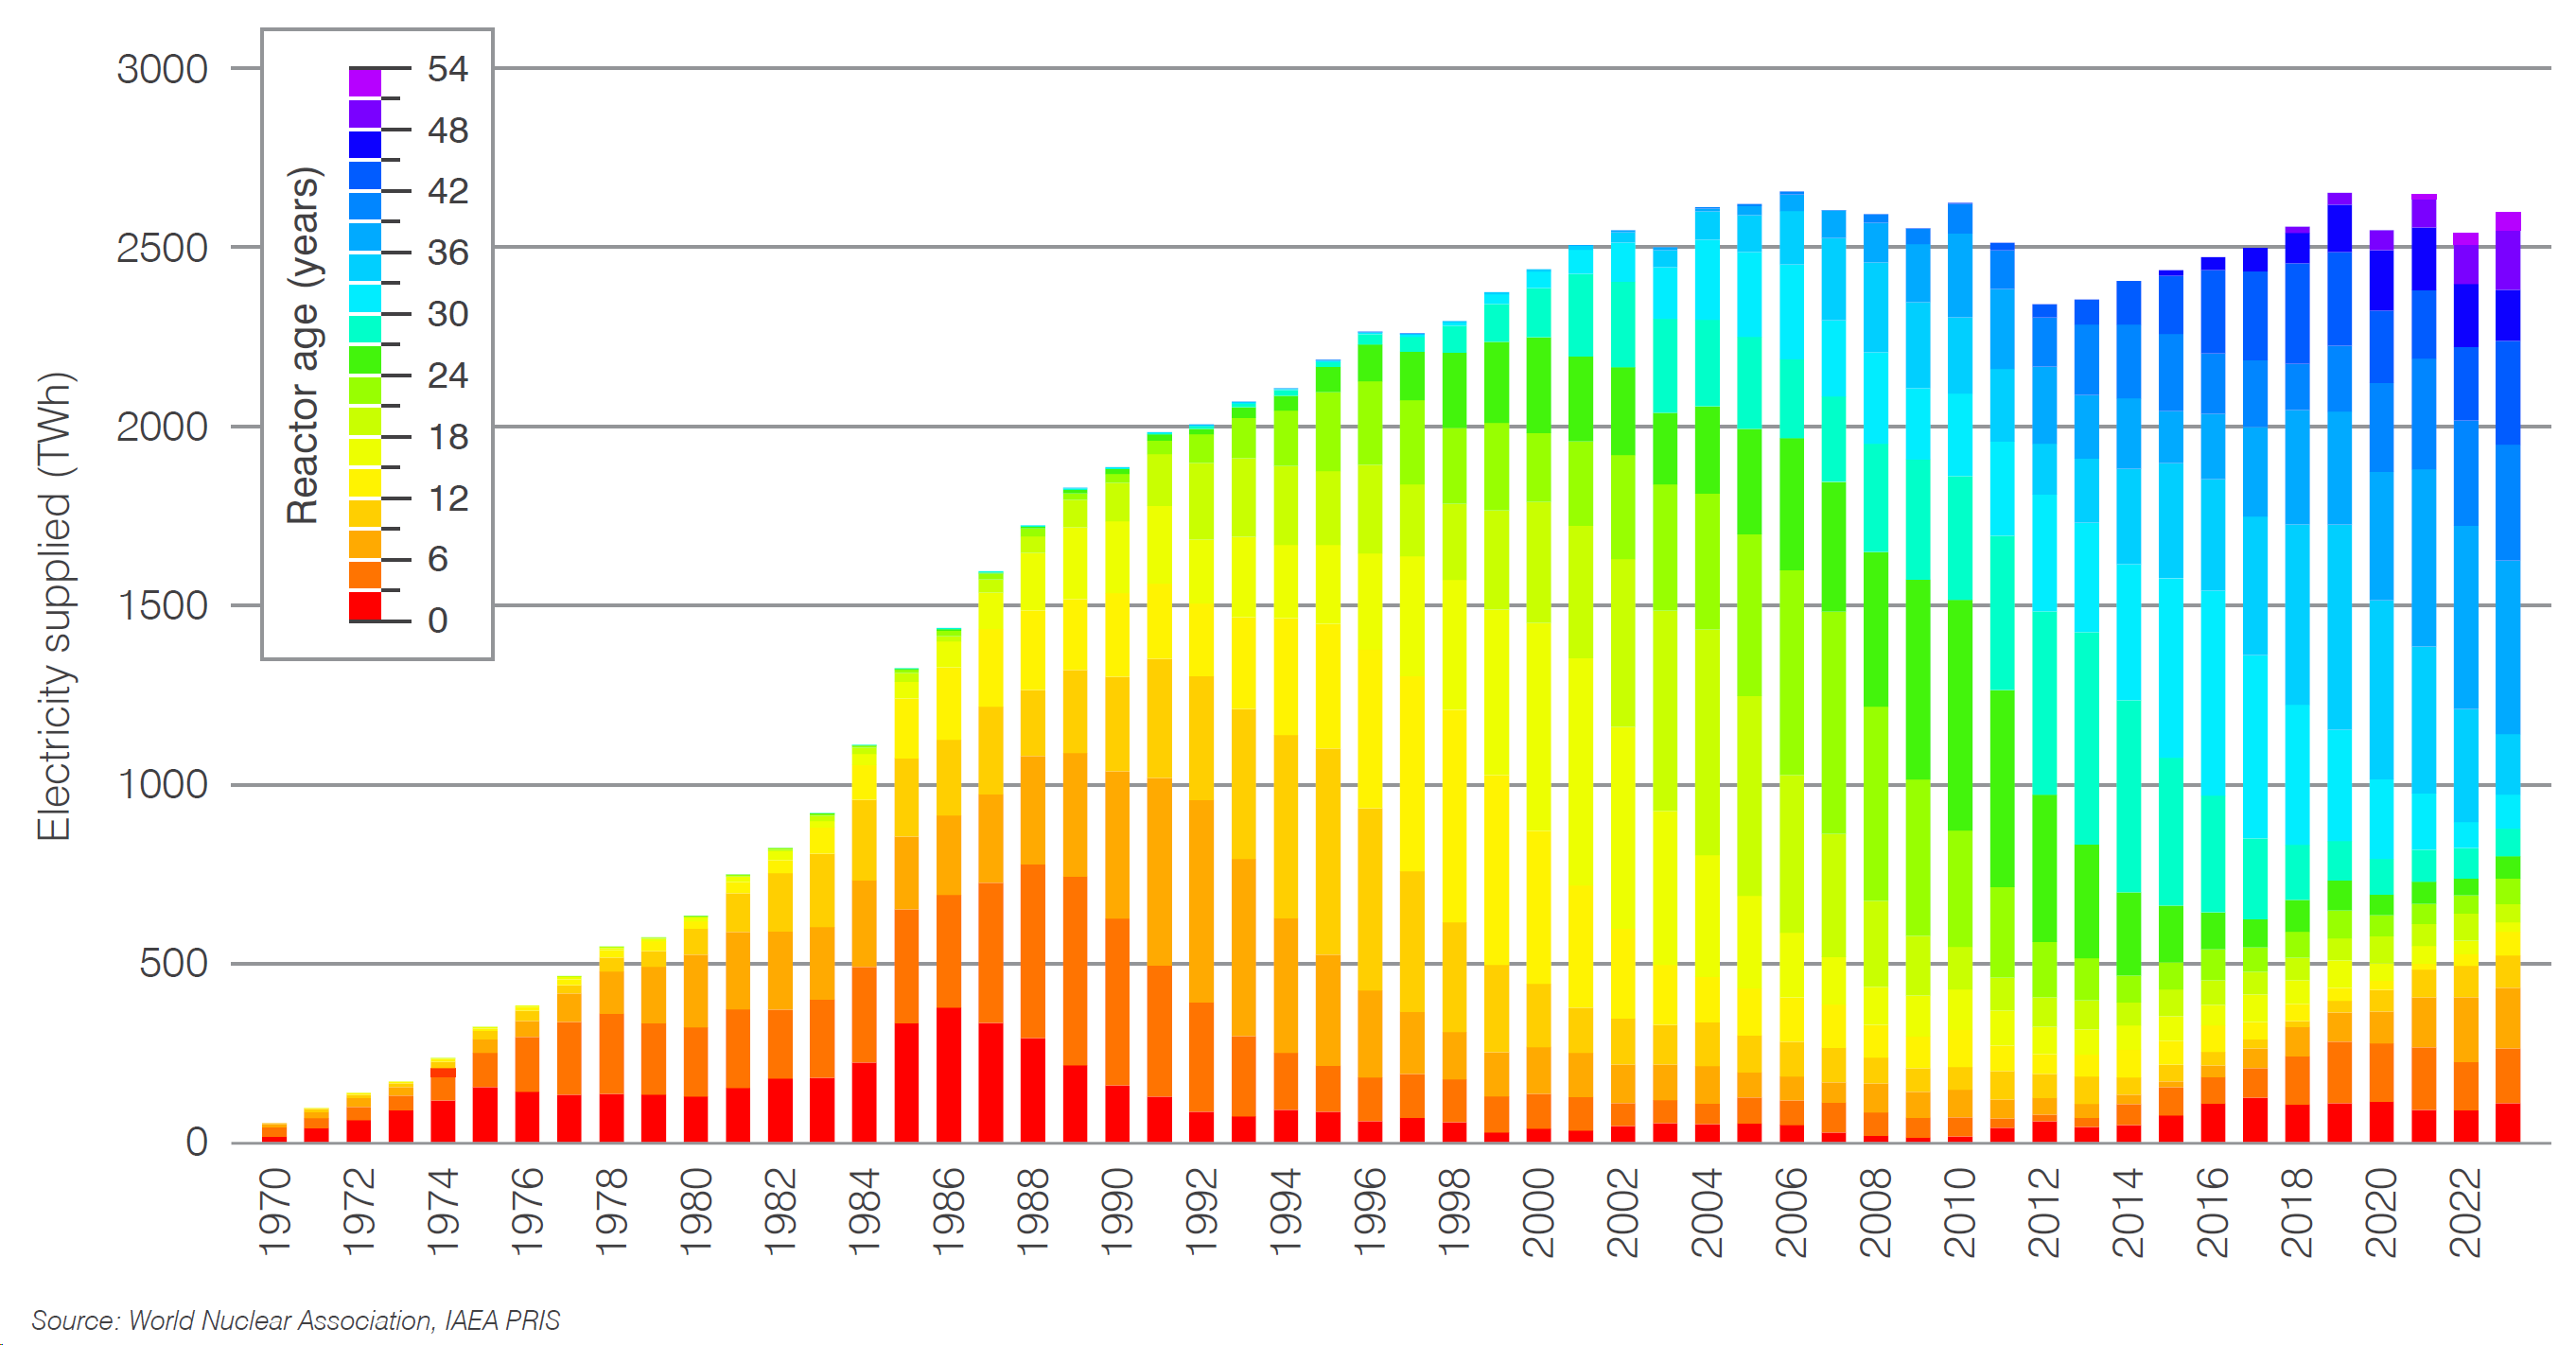
Figure 4 shows total global electricity generation from nuclear power plants by age in each year since 1970, with generation from reactors of different ages shown in distinct colours.
The rapid expansion of nuclear capacity in the 1970s and 80s is reflected in the predominance of electricity generated from young reactors. As the number of new reactors coming online fell in the 1990s and the reactors built in the 1970s and 1980s entered their second and third decades of operation, the proportion of electricity generated from older reactors increased.
Over the last decade, with the number of new reactors entering service each year gradually increasing, the amount of electricity generated by younger reactors has started to increase again. Most of the reactors built since 1970s have continued to operate, meaning the amount of electricity generated by reactors in their fourth, fifth and sixth decades of operation has continued to rise.
Figure 4. Total global nuclear electricity generation by age of reactor
Reactor construction, operation and shutdown
In 2023 the global average capacity factor was 81.5%, up from 80.4% in 2022, continuing the trend of high global capacity factors seen since 2000. Capacity factors in this section are based on the performance of those reactors that report electricity generation in any one calendar year.
In 2024 construction began on nine large pressurized water reactors (PWRs), six in China and one each in Egypt, Pakistan and Russia.
Table 2. Reactor construction starts in 2024
| Location | Model | Process | Capacity (MWe) | Construction start | |
|---|---|---|---|---|---|
| Chashma 5 | Pakistan | Hualong One | PWR | 1100 | 31 December 2024 |
| El Dabaa 4 | Egypt | VVER-1200/V-529 | PWR | 1100 | 23 January 2024 |
| Leningrad II-3 | Russia | VVER V-491 | PWR | 1101 | 14 March 2024 |
| Lianjiang 2 | China | CAP1000 | PWR | 1161 | 26 April 2024 |
| Ningde 5 | China | Hualong One | PWR | 1116 | 28 July 2024 |
| Shidaowan 1 | China | Hualong One | PWR | 1134 | 28 July 2024 |
| Xudabao 2 | China | CAP1000 | PWR | 1000 | 17 July 2024 |
| Zhangzhou 3 | China | Hualong One | PWR | 1126 | 22 February 2024 |
| Zhangzhou 4 | China | Hualong One | PWR | 1129 | 27 September 2024 |
With nine construction starts in 2024, and seven reactor connections to the grid, the total number of units under construction at the end of 2024 was 62, one more than at the end of 2023.
| BWR | FBR | PHWR | PWR | Total | |
|---|---|---|---|---|---|
| Argentina | 1 | 1 | |||
| Bangladesh | 2 | 2 | |||
| Brazil | 1 | 1 | |||
| China | 2 | 27 (+3) | 29 (+3) | ||
| Egypt | 4 (+1) | 4 (+1) | |||
| India | 1 | 2 (-1) | 4 | 7 (-1) | |
| Japan | 2 | 2 | |||
| Pakistan | 1 | 1 | |||
| Russia | 1 | 3 (+1) | 4 (+1) | ||
| Slovakia | 1 | 1 | |||
| South Korea | 2 | 2 | |||
| Turkey | 4 | 4 | |||
| Ukraine | 2 | 2 | |||
| United Arab Emirates | 0 (-1) | 0 (-1) | |||
| United Kingdom | 2 | 2 | |||
| United States of America | 0 (-1) | 0 (-1) | |||
| Total | 2 | 4 | 2 (-1) | 54 (+3) | 63 (+2) |
In 2024 seven reactors were connected to the grid for the first time, including three reactors in China and one reactor each in France, India, United Arab Emirates and USA.
Construction times for these seven reactors differed widely. The mean construction time for all seven reactors was 114 months, with the fastest construction being the Zhangzhou 1 Hualong One in China, which was constructed in 61 months; and the slowest being the Flamanville 3 EPR in France, which took 204 months from first concrete to grid connection.
The construction time of Shidaowan Guohe One 1 is uncertain, as there has been no announcement of first concrete. The construction start date is based on satellite imagery. Nevertheless, the construction time of around 64 months is remarkable for a first-of-a-kind reactor design
Figure 5. Construction times of units grid-connected in 2024
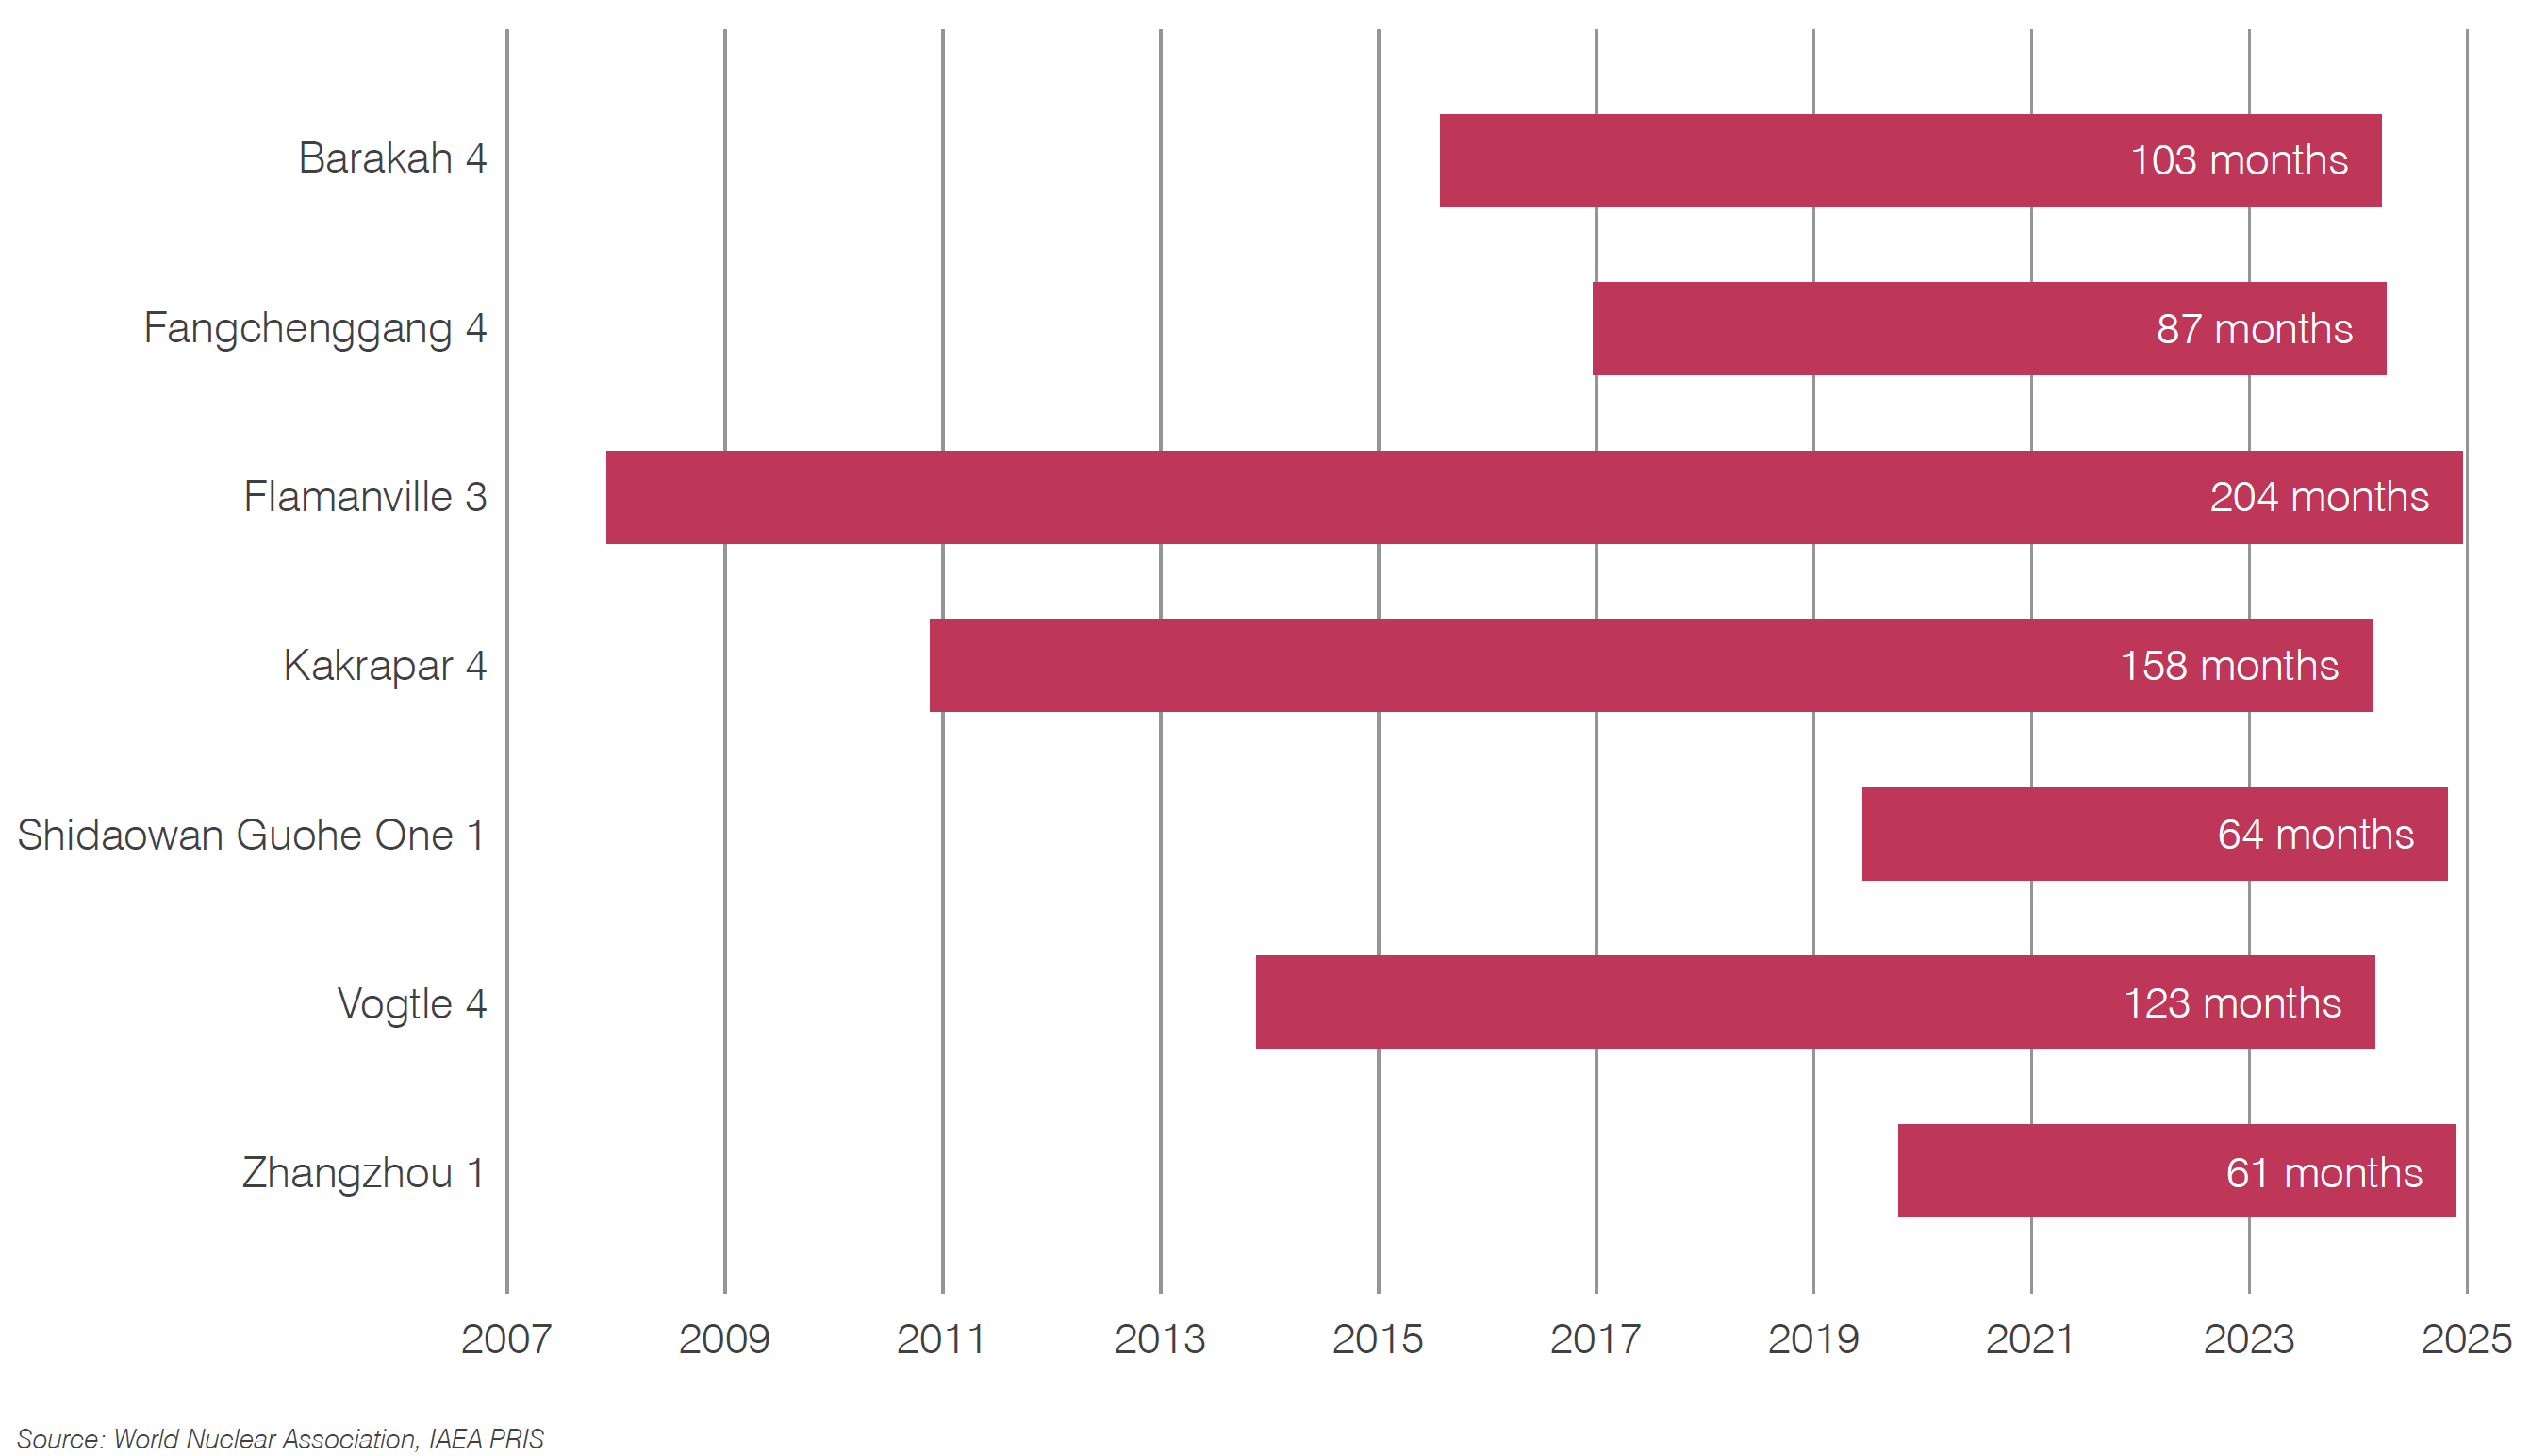
Table 4. Reactor grid connections in 2024
| Model | Process | Net capacity (MWe) | Construction start |
Grid connection |
Construction time (months) |
|
|---|---|---|---|---|---|---|
| Zhangzhou 1 | Hualong One | PWR | 1126 | 16 October 2019 | 28 November 2024 | 61 |
| Vogtle 4 | AP1000 | PWR | 1117 | 19 November 2013 | 1 March 2024 | 123 |
| Shidaowan Guohe One 1 |
CAP1400 | PWR | 1400 | 19 June 2019 (estimate) |
31 October 2024 | 64 |
| Kakrapar 4 | PHWR-700 | PHWR | 630 | 22 November 2010 | 20 February 2024 | 158 |
| Flamanville 3 | EPR | PWR | 1630 | 3 December 2007 | 21 December 2024 | 204 |
| Fangchenggang 4 | HPR1000 | PWR | 1105 | 23 December 2016 | 9 April 2024 | 87 |
| Barakah 4 | APR-1400 | PWR | 1337 | 30 July 2015 | 23 March 2024 | 103 |
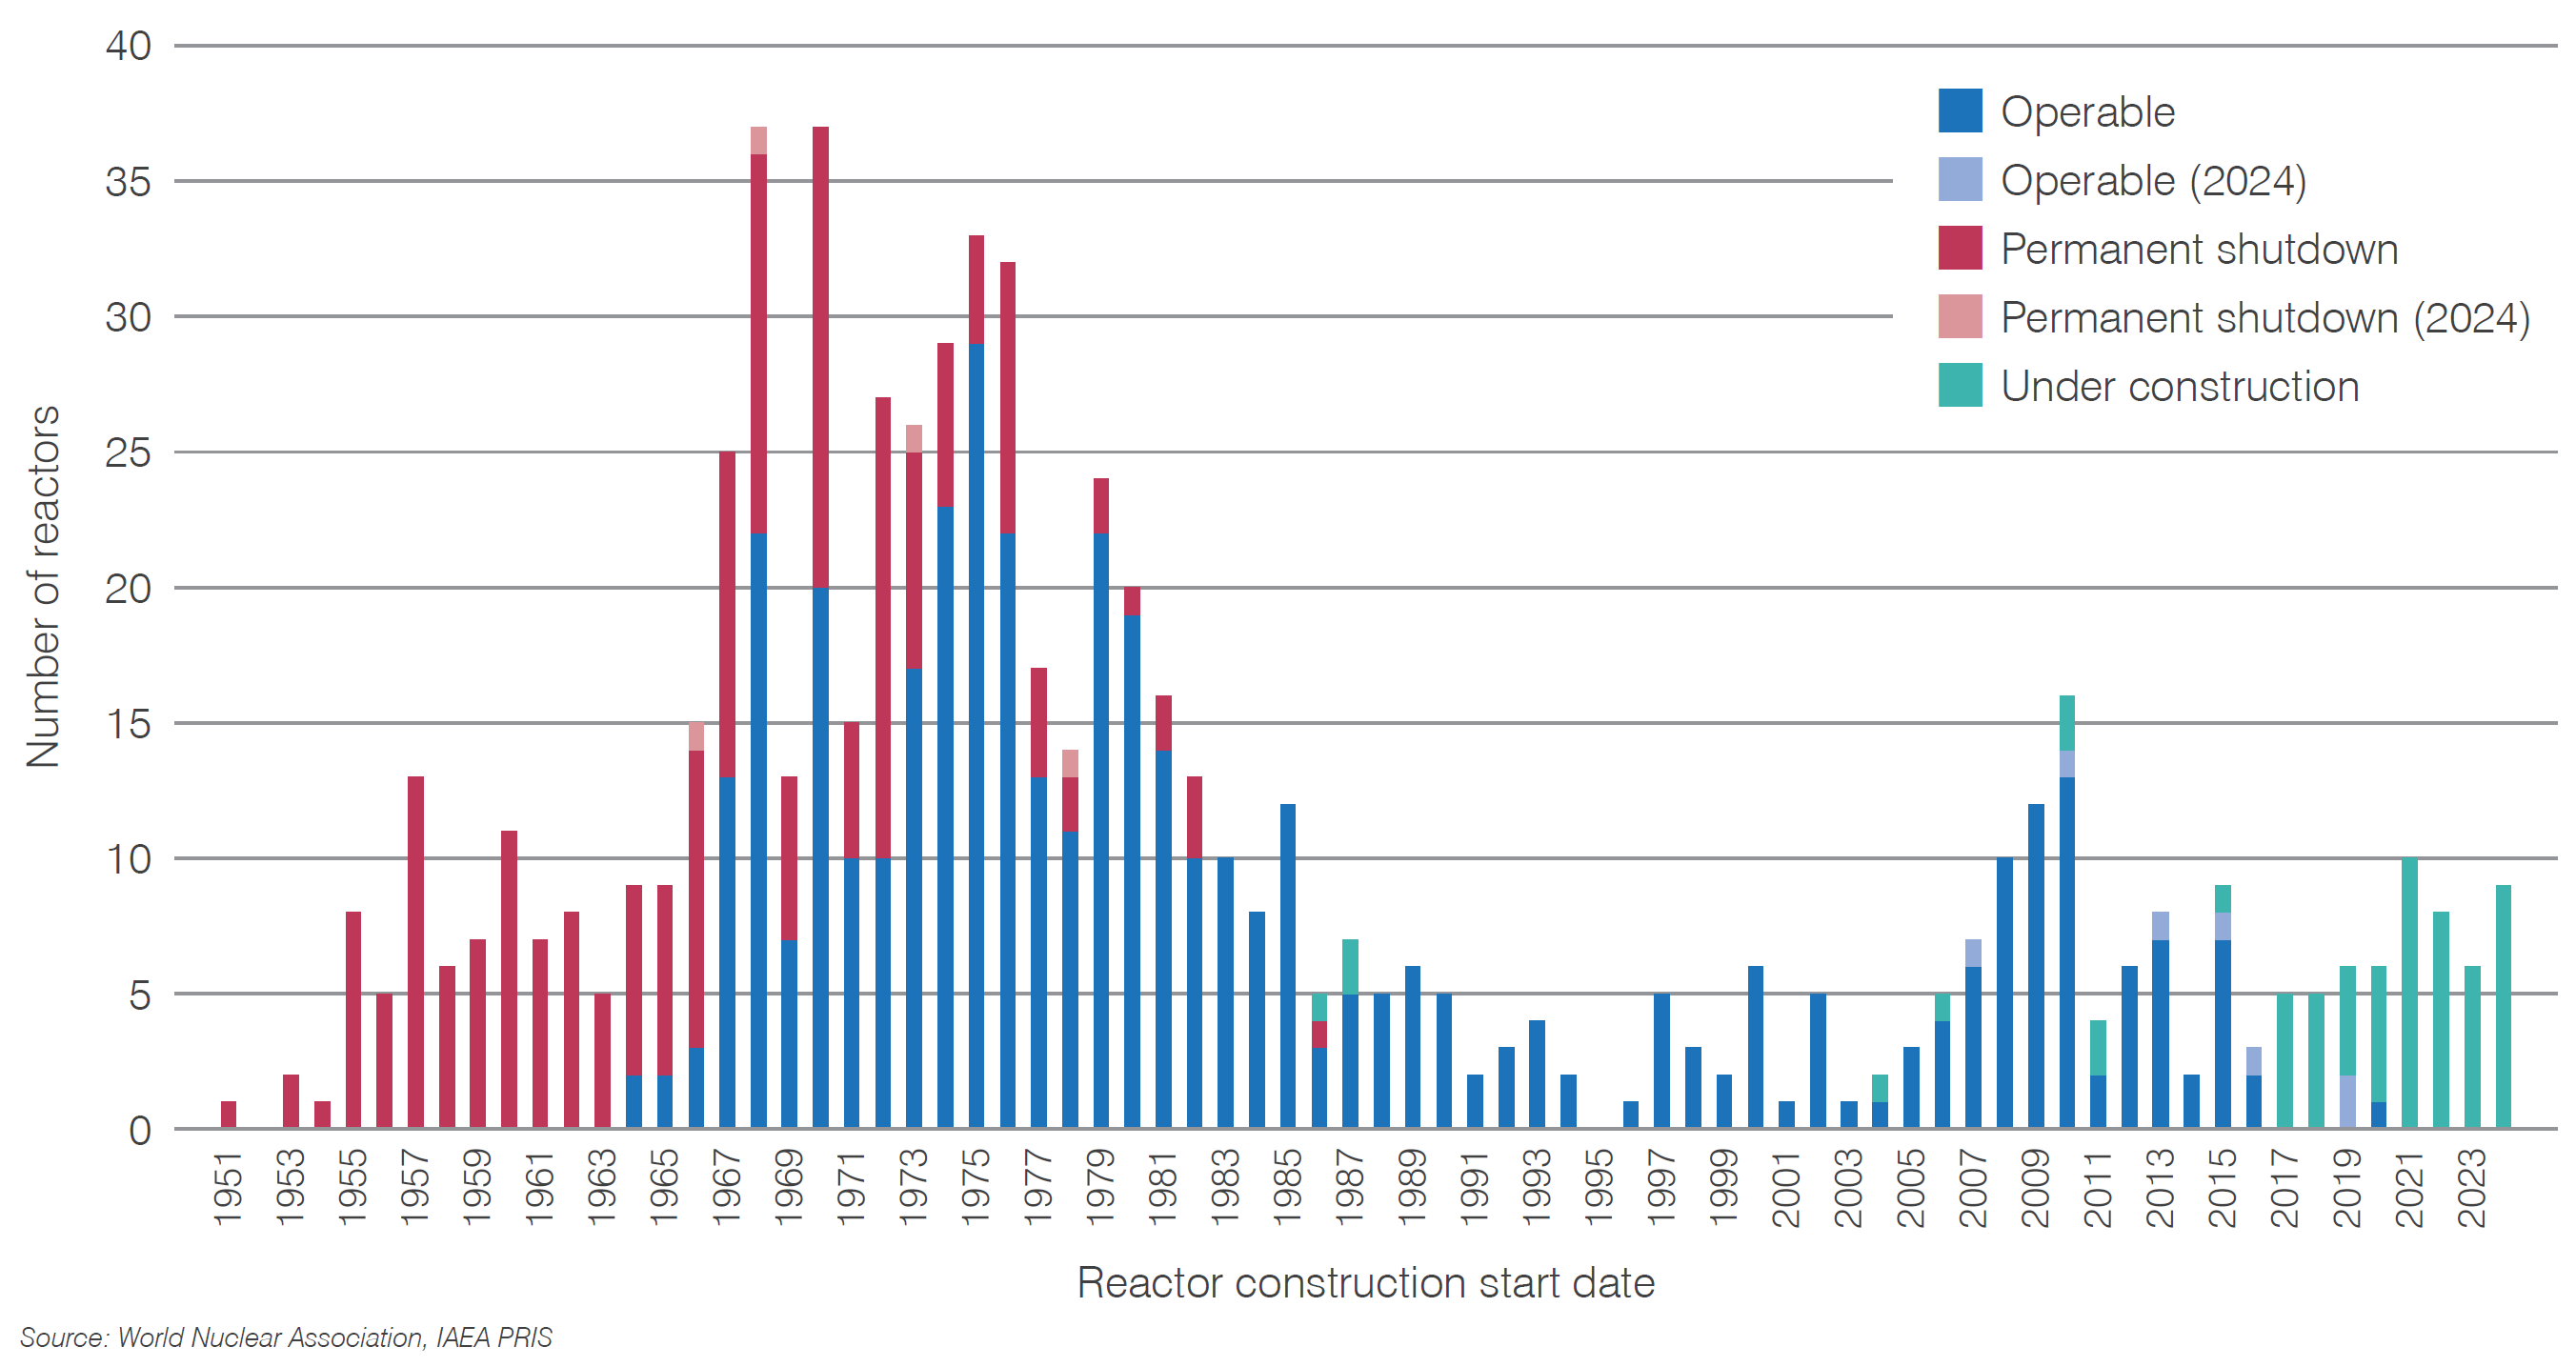
Most reactors under construction today started construction in the last seven years. Of those taking more than ten years, most have periods where construction has been suspended. This includes Khmelnitski 3&4 in Ukraine, where construction was halted in 1990. Construction might be completed on unit 4 after Energoatom signed an agreement with Westinghouse in 2021, however there have also been proposals for new construction projects at that site. In Slovakia, construction started in 1987 on Mochovce 3&4, was halted in 1990 and recommenced in 2015. Mochovce 3 was connected to the grid in in January 2023, and work is continuing to bring unit 4 into service. Construction on Shimane 3 and Ohma in Japan were halted in 2011. Both Angra 3 in Brazil and the Carem25 unit at the Atucha site in Argentina have seen construction suspended intermittently.
Of all reactors under construction today, only the PFBR prototype and Rajasthan 8 PHWR, both in India, have continuous construction times longer than ten years.
Figure 6. Operational status of reactors by construction start year
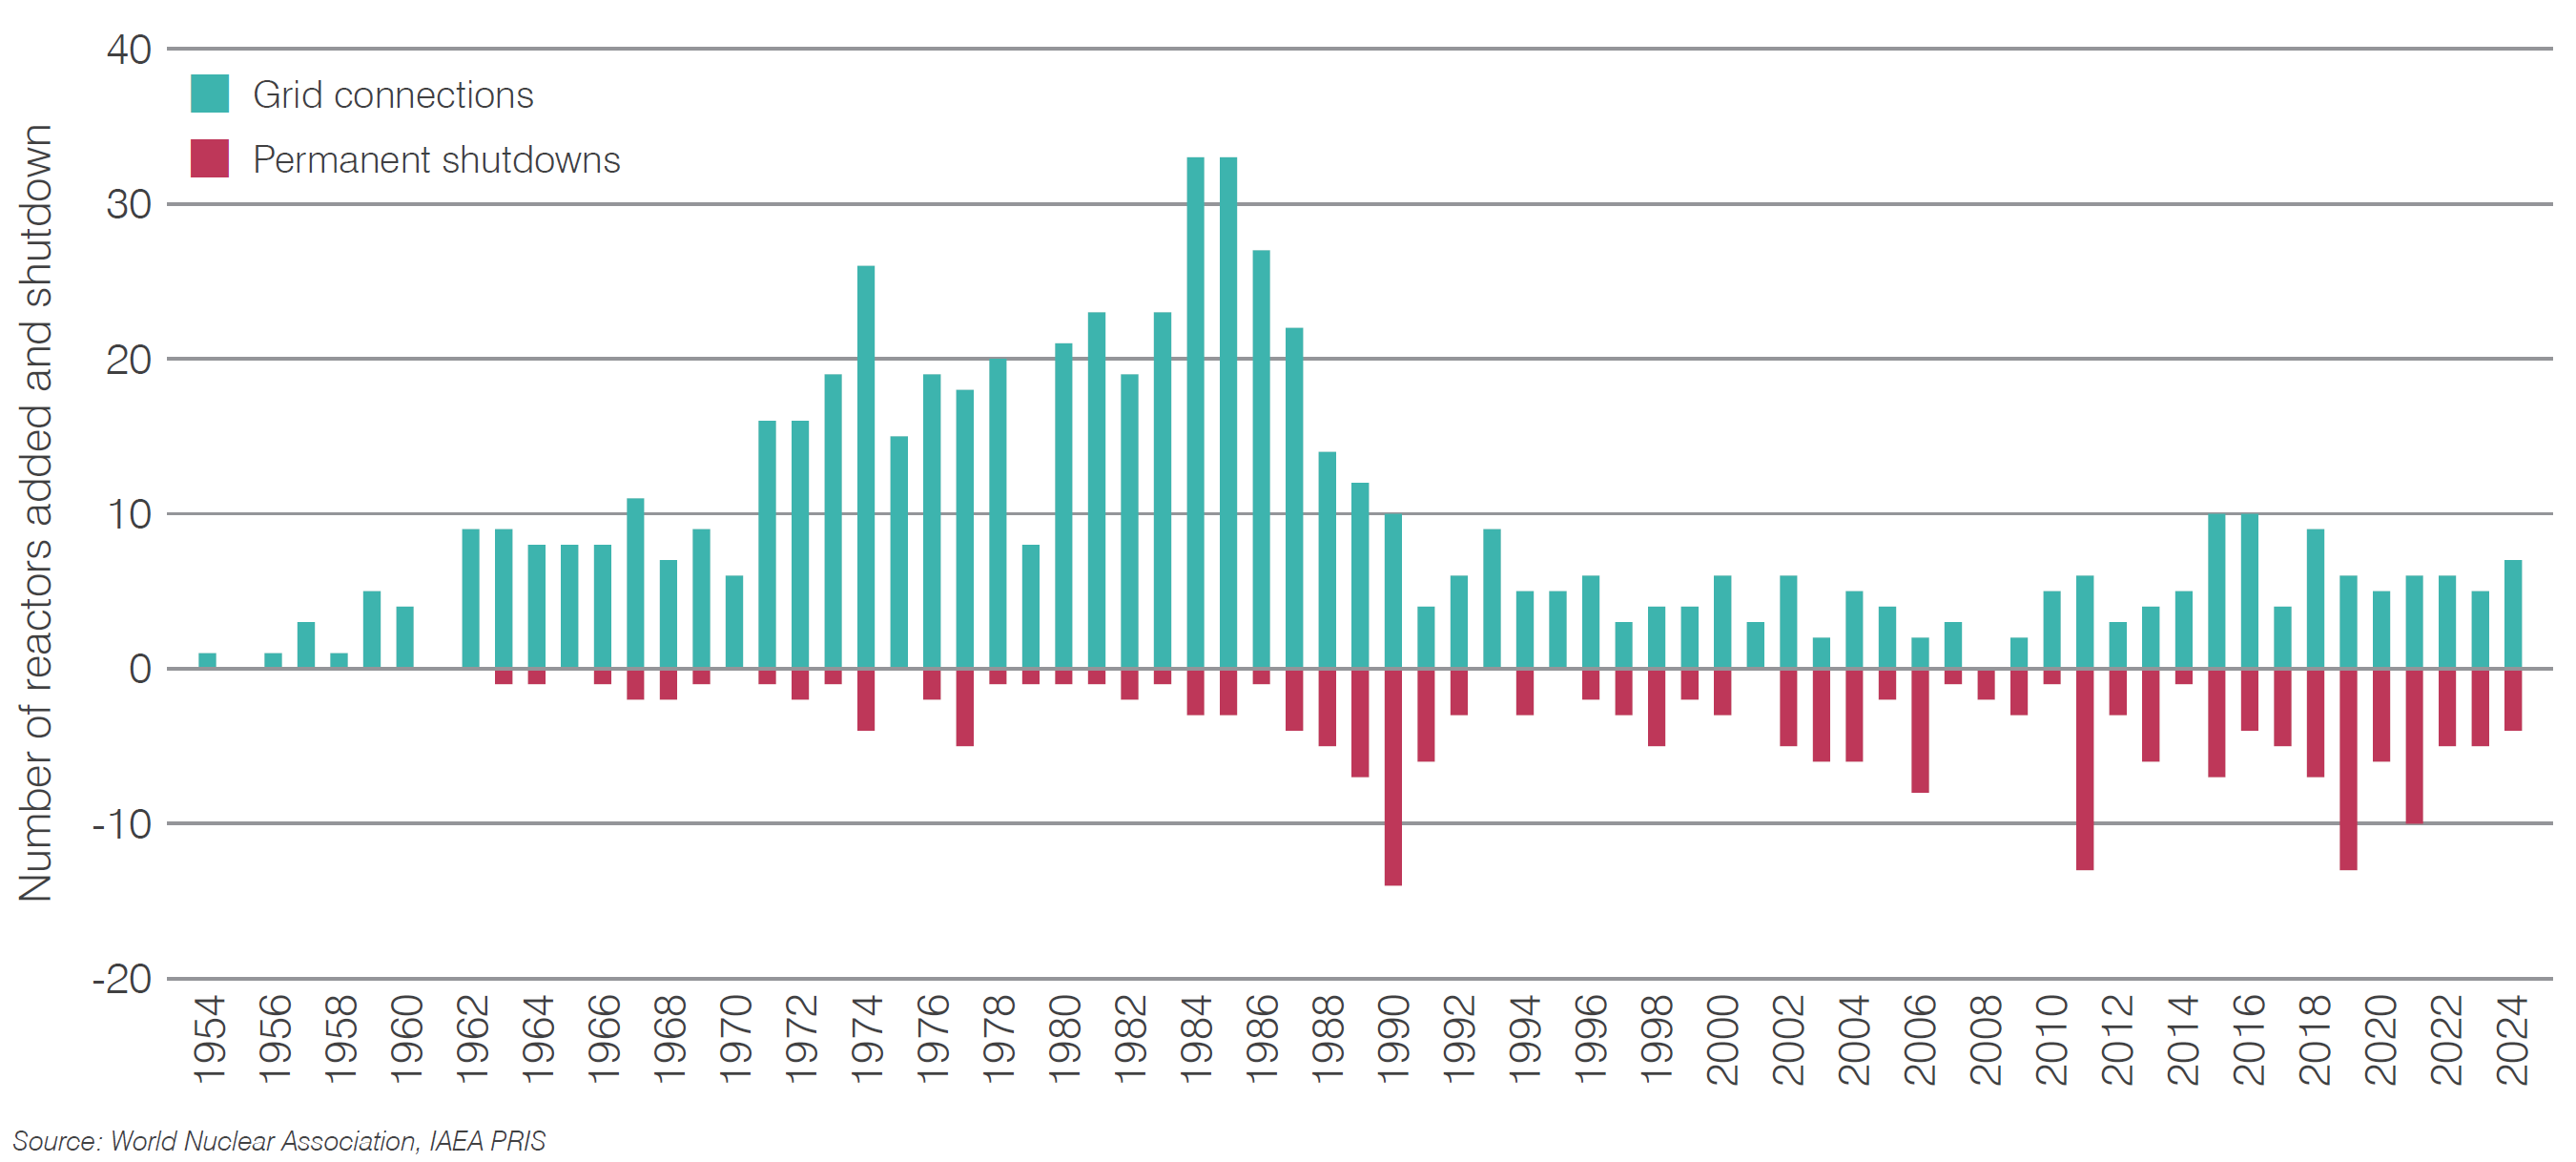
Four reactors were permanently shut down in 2024. These include Kursk 2 in Russia, an RBMK light water graphite reactor, Pickering 1&4 PHWRs in Canada, which had operated for 53 and 51 years respectively and Maanshan 2, a 41-year-old PWR that was closed as part of the Taiwanese government phase-out policy.
Table 5. Shutdown reactors in 2024
| Location | Model | Process | Capacity (MWe) | Permanent shutdown | |
| Kursk 2 | Russia | RBMK-1000 | LWGR | 925 | 31 January 2024 |
| Pickering 1 | Canada | CANDU 500A | PHWR | 515 | 28 July 2024 |
| Maanshan 1 | Taiwan | WE 312 | PWR | 936 | 1 October 2024 |
| Pickering 4 | Canada | CANDU 500A | PHWR | 515 | 31 December 2024 |
In 2024, with seven grid connections and four permanent shutdowns, the number of operable reactors worldwide increased by three, to 440.
Figure 7. Reactor first grid connections and shutdowns 1954-2024
Operating performance
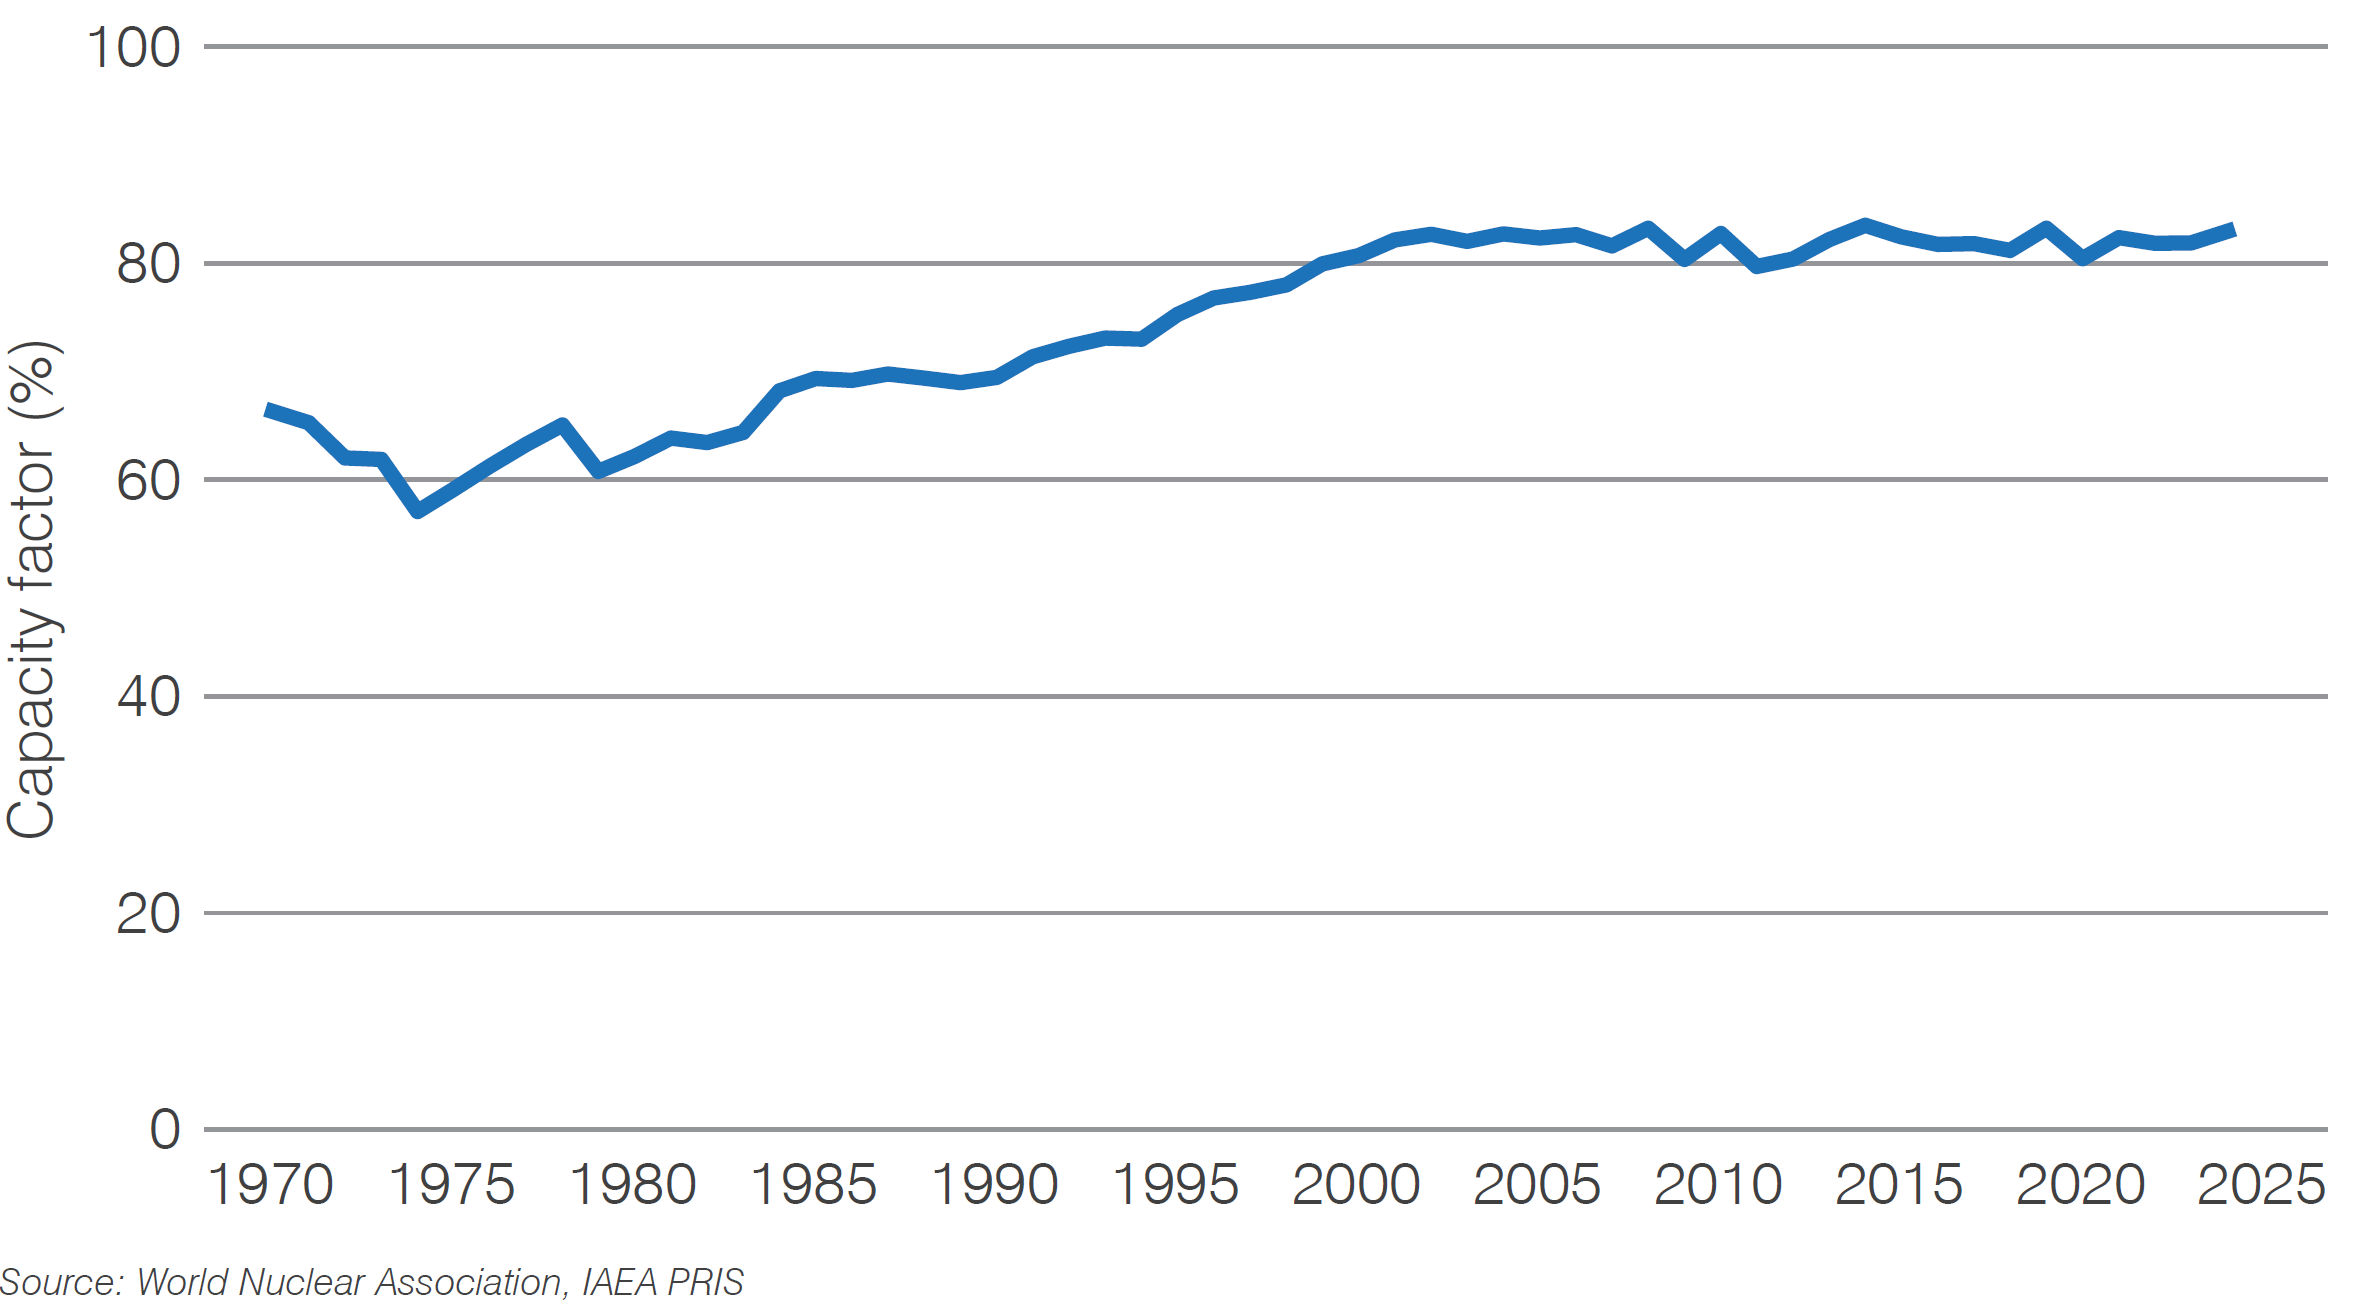
In 2024 the global average capacity factor was 83%, up from 82% in 2023, continuing the trend of high global capacity factors seen since 2000. Capacity factors in this section are based on the performance of those reactors that report electricity generation in any one calendar year.
Figure 8. Global average capacity factor
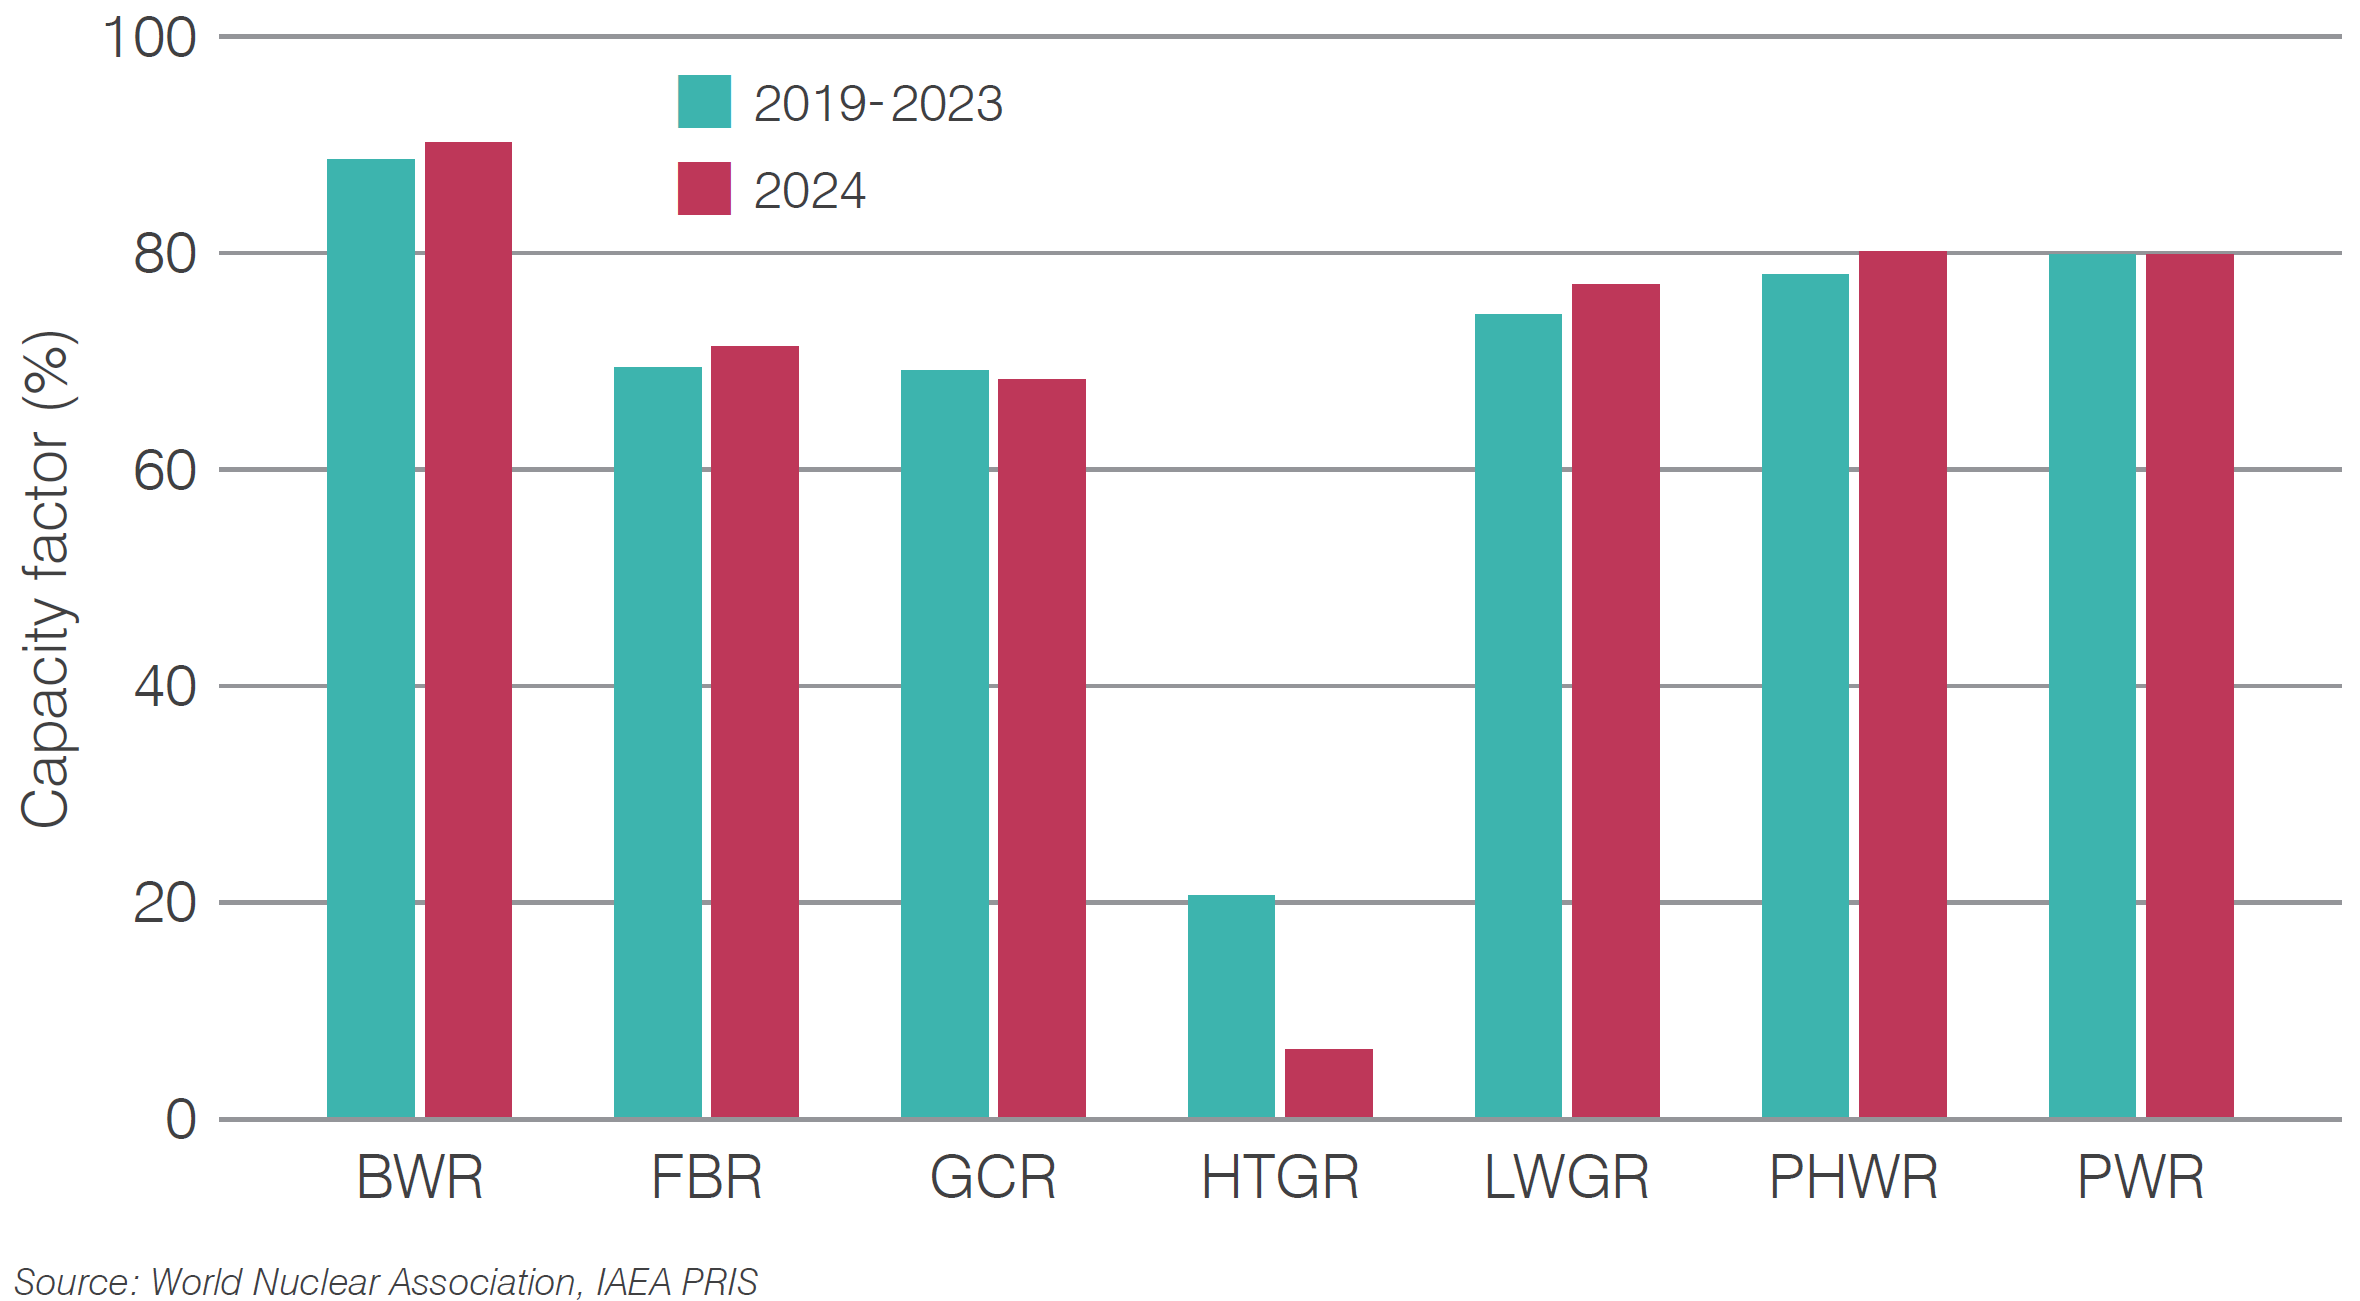
Capacity factors for different reactor types were broadly consistent with the average achieved over the previous five years. The high-temperature gas-cooled reactor category is represented by only one reactor, Shidaowan HTR-PM 1 in China.
Figure 9. Capacity factor by reactor type
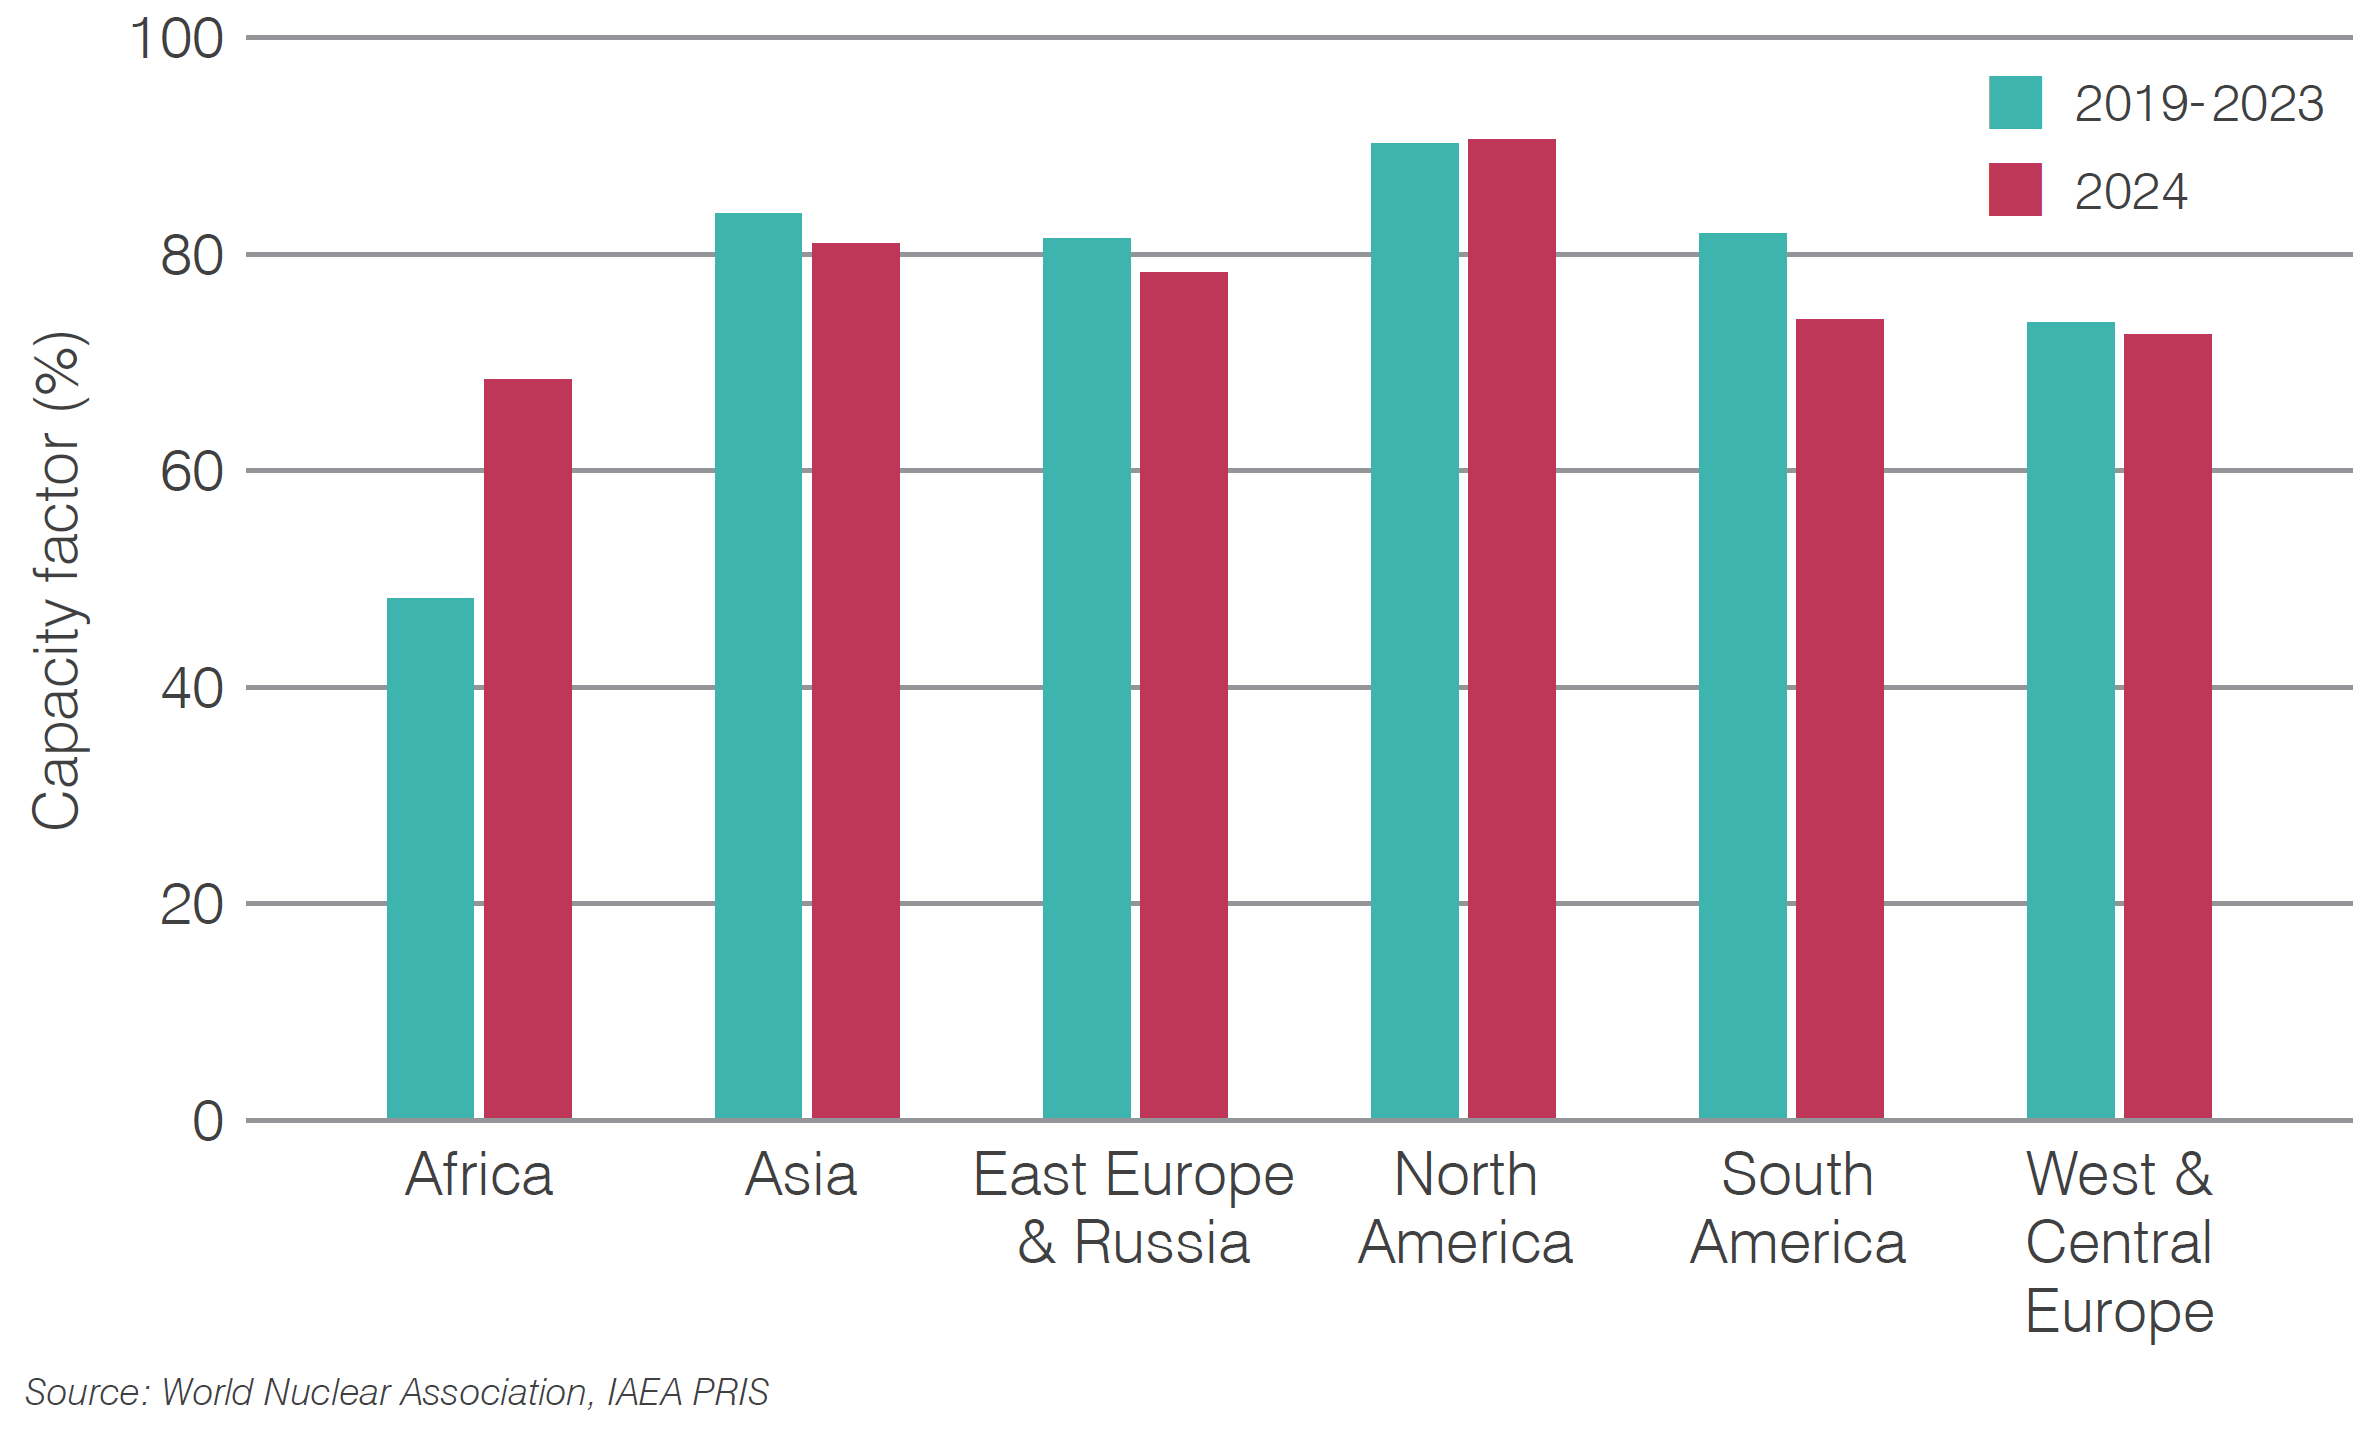
In 2024 the capacity factor of reactors in the geographical regions shown in Figure 10 were also broadly consistent with those achieved over the previous five years. Reactors in North America maintained the highest average capacity factors, achieving an average of 90%. South Africa's Koeberg 2 was offline until December 2024, when it restarted after the completion of extensive maintenance to extend the unit's operating lifetime by 20 years.
Figure 10. Capacity factor by region
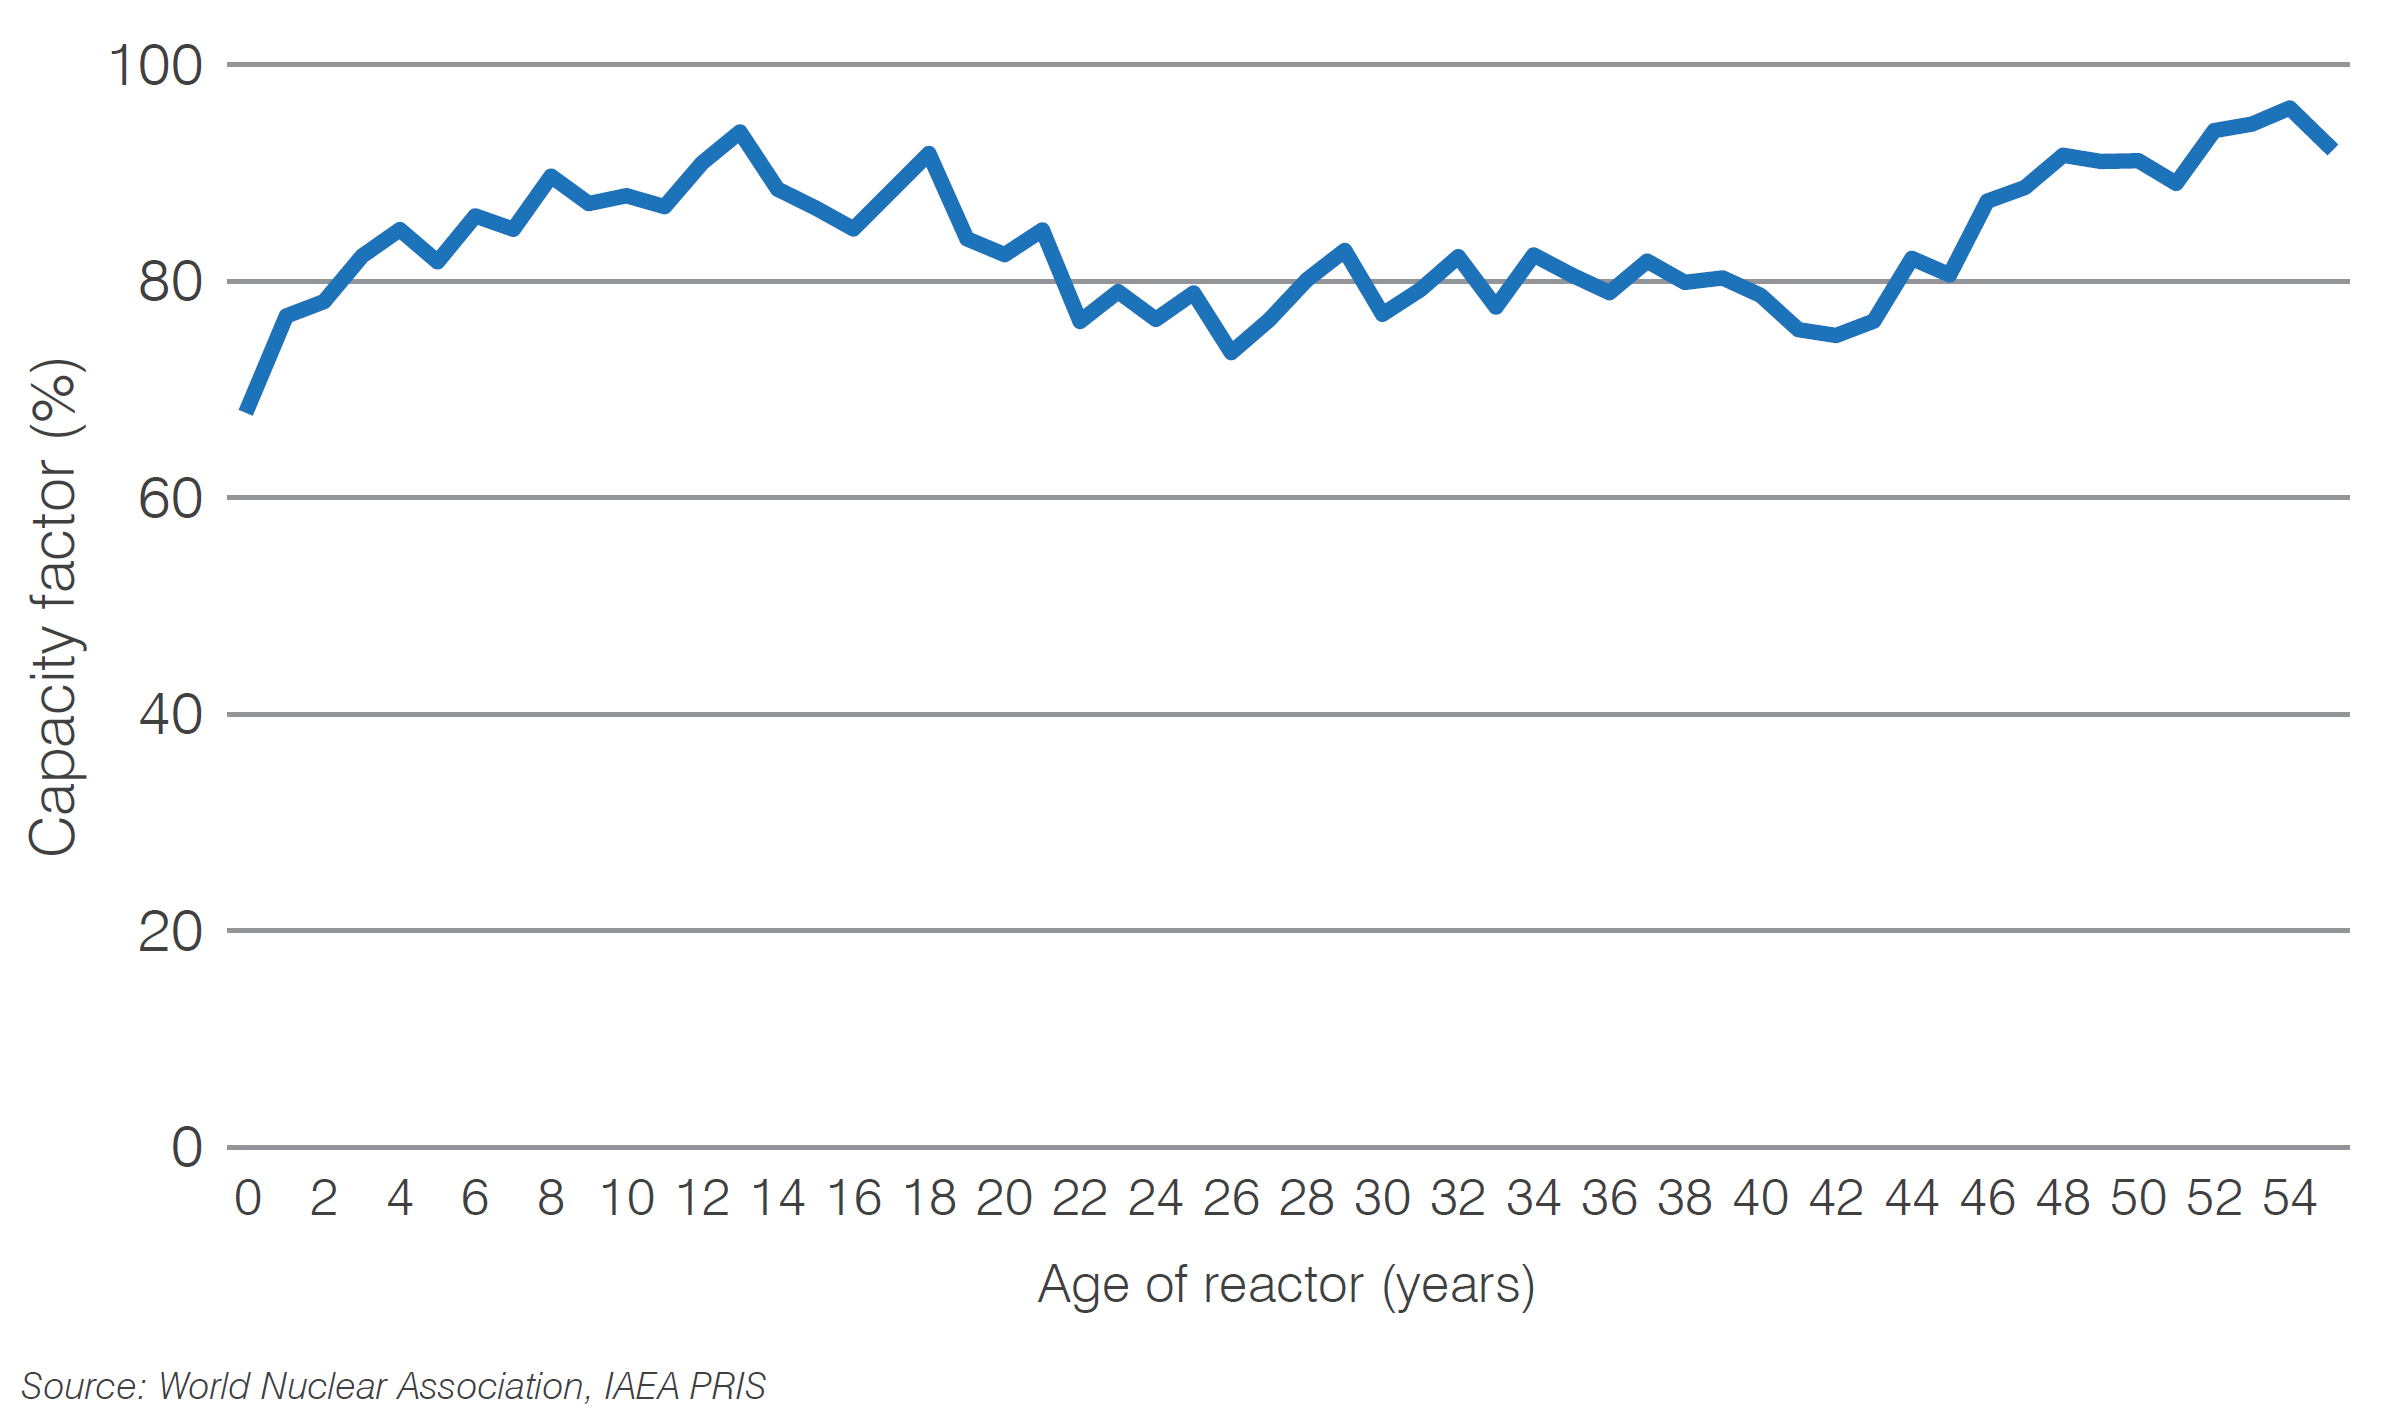
As observed in previous years, there is no overall age-related decline in nuclear reactor performance, in terms of average capacity factors achieved by reactors of different ages. This includes reactors that have operated for 40 years and longer, which is a positive indication for the potential of reactors continue to function well when entering periods of extended operation.
Figure 11. Mean capacity factor 2019-2024 by age of reactor
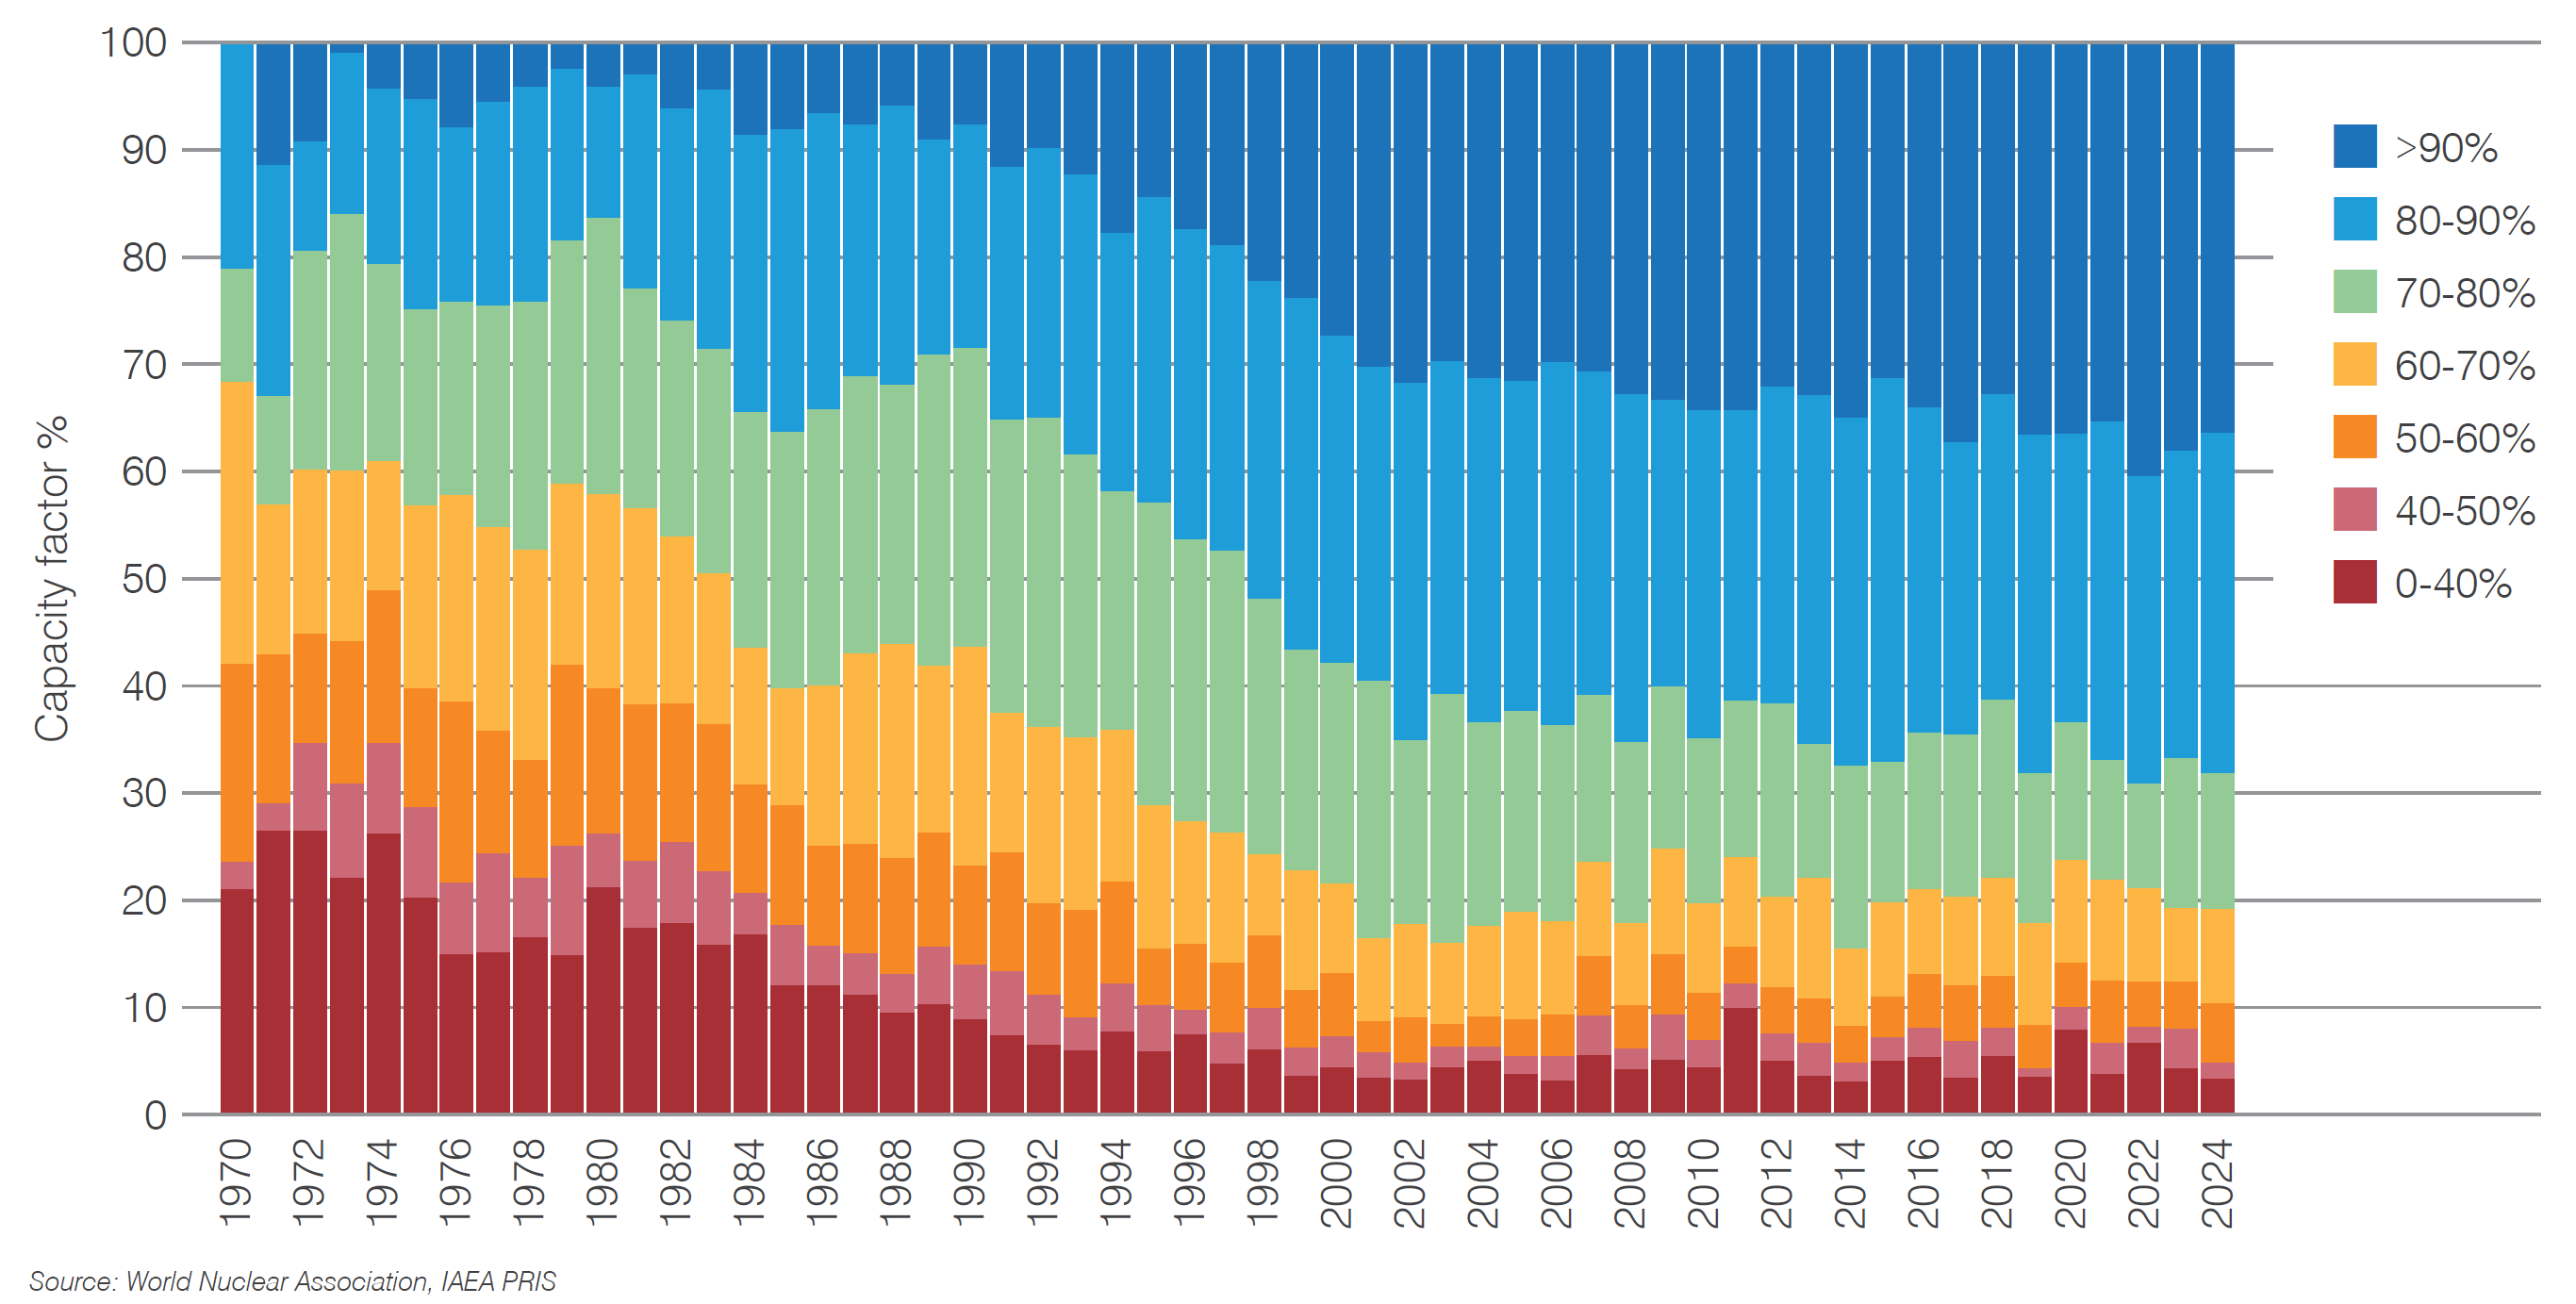
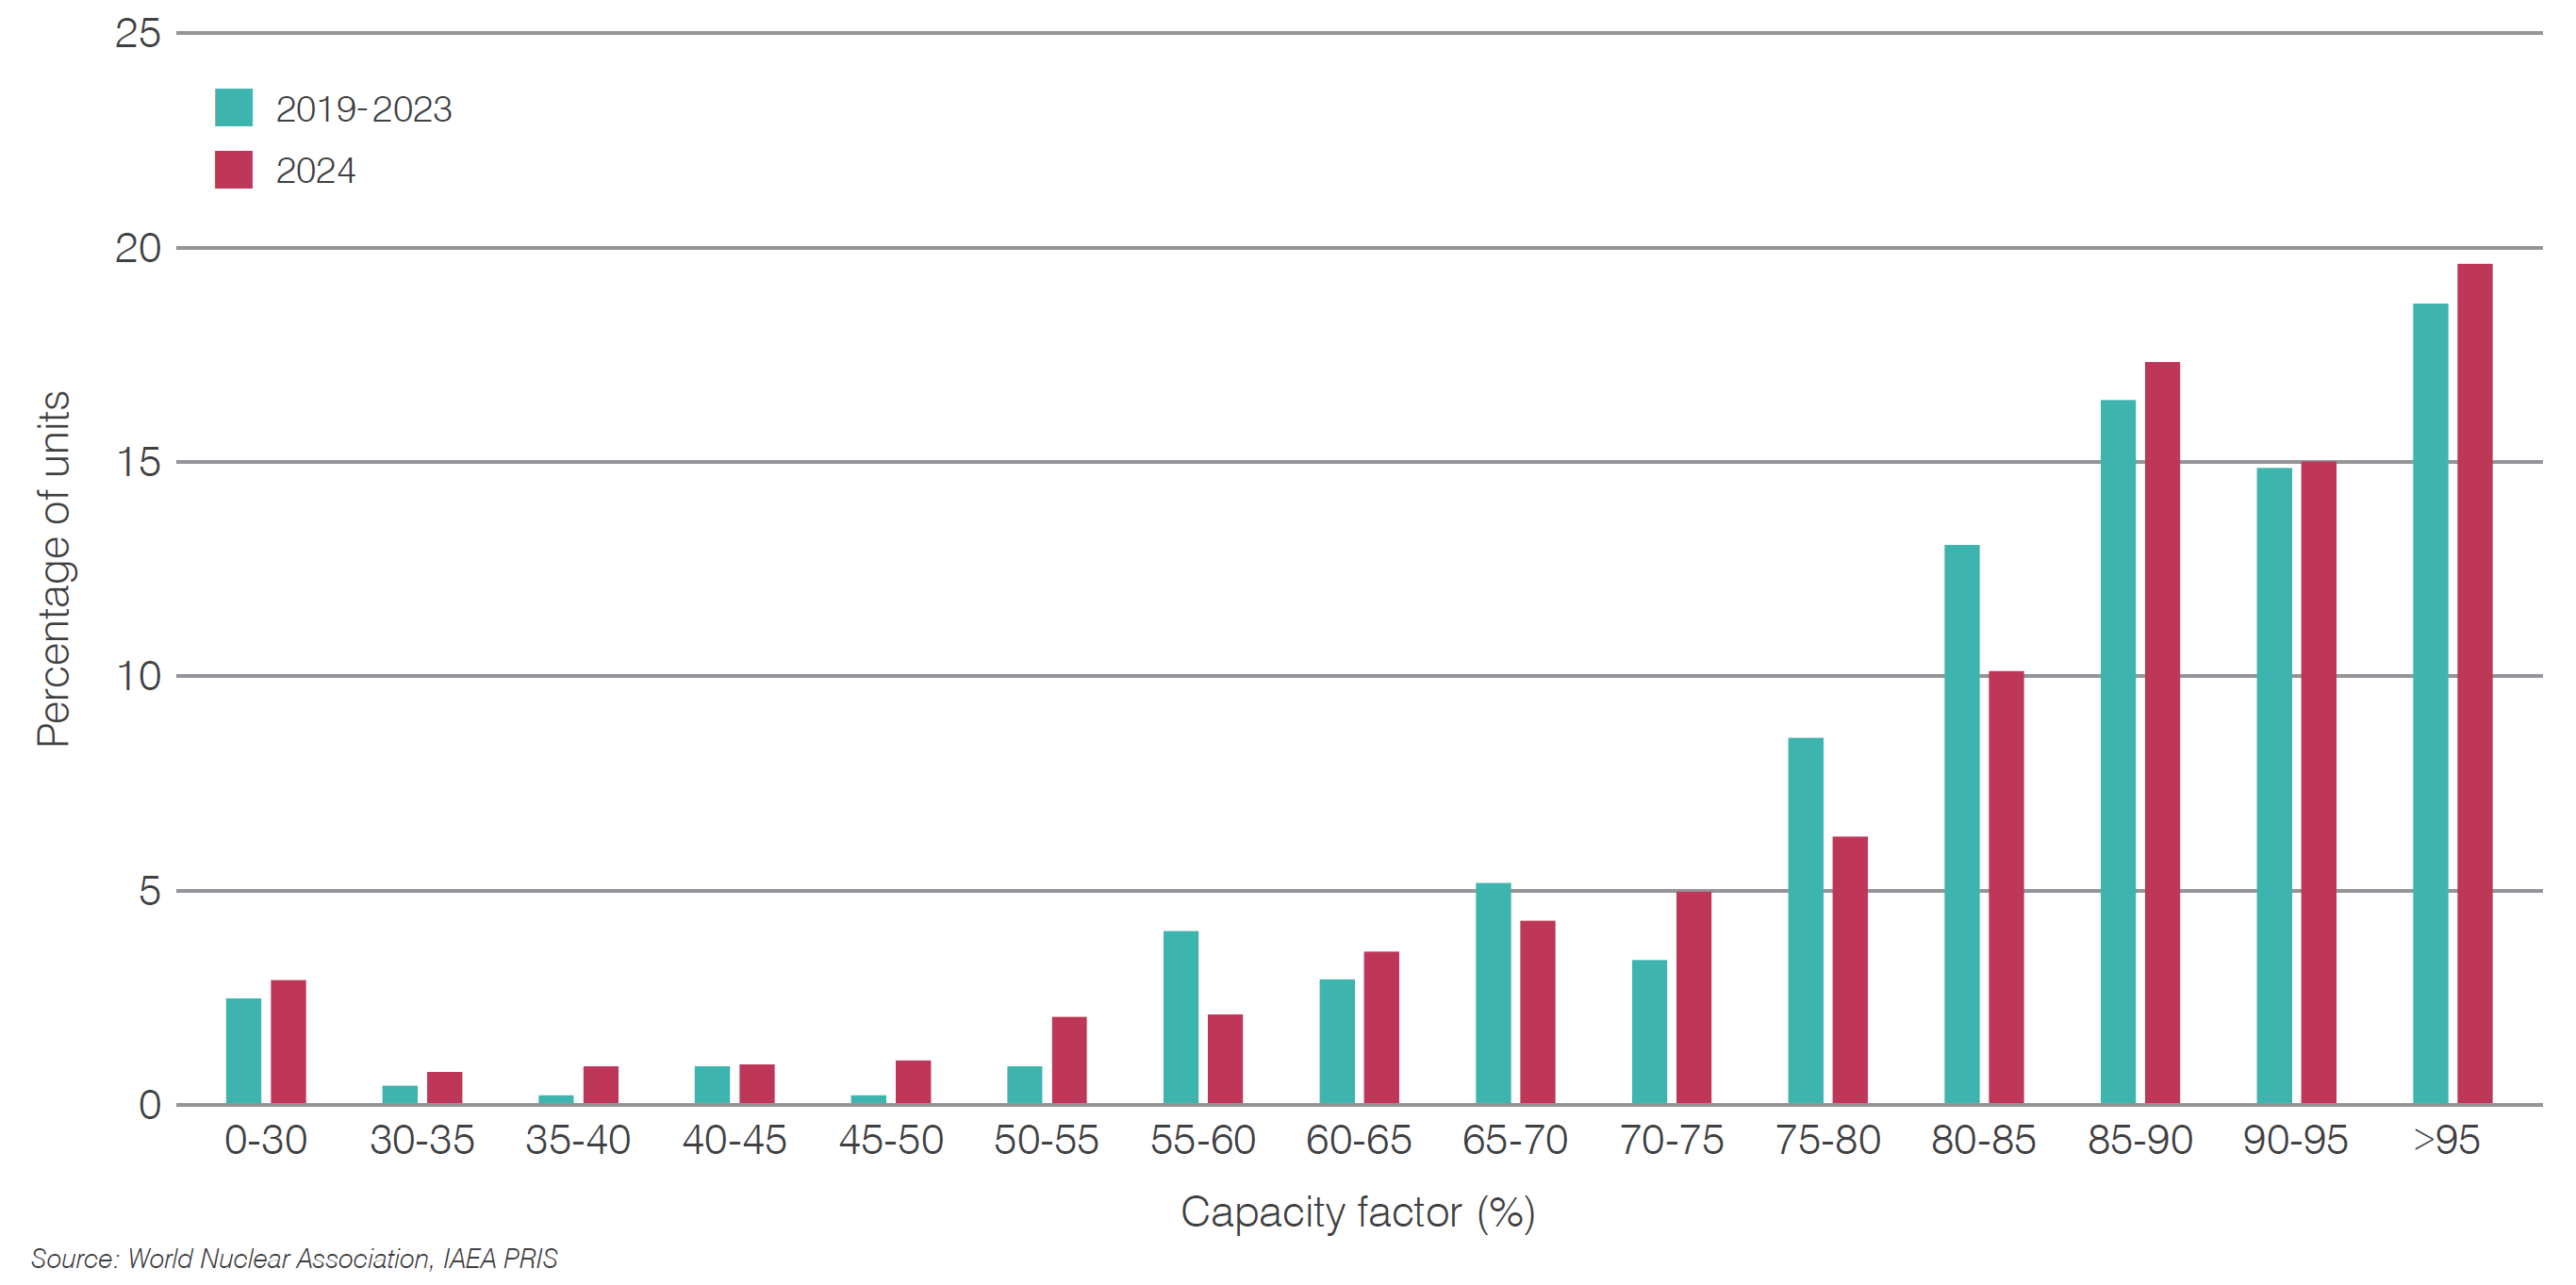
The spread of capacity factors in 2024 is broadly similar to the average of the previous five years, with over 60% of reactors achieving a capacity factor more than 80%.
Figure 12. Percentage of units by capacity factor
There has been a steady growth in average capacity factors in each decade since the 1970s, with the greatest improvements taking place in the 1980s and ’90s, although capacity factors continued to increase in subsequent decades. The capacity factor deciles in 2024 were broadly similar to those recent years.
Figure 13. Long-term trends in capacity factor