Nuclear Power in the World Today
- The first commercial nuclear power stations started operation in the 1950s.
- Nuclear energy now provides about 9% of the world's electricity from about 440 power reactors.
- Nuclear provides about one-quarter of the world’s low-carbon electricity.
- Nuclear is the world's second largest source of low-carbon power.
- Over 50 countries utilize nuclear energy in about 220 research reactors. In addition to research, these reactors are used for the production of medical and industrial isotopes, as well as for training.
Nuclear technology uses the energy released by splitting the atoms of certain elements. It was first developed in the 1940s, and during the Second World War research initially focused on producing bombs. In the 1950s attention turned to the peaceful use of nuclear fission, controlling it for power generation. For more information, see page on History of Nuclear Energy.
Civil nuclear power can now boast around 20,000 reactor years of operating experience, and nuclear power plants are operational in 31 countries (plus Taiwan) worldwide. In fact, through regional transmission grids, many more countries depend in part on nuclear-generated power, particularly in Europe.
When the commercial nuclear industry began in the 1960s, there were clear boundaries between the industries of the East and West. Today, the nuclear industry is characterized by international commerce. A reactor under construction in Asia today may have components supplied from South Korea, Canada, Japan, France, Germany, Russia, and other countries. Similarly, uranium from Australia or Namibia may end up in a reactor in the UAE, having been converted in France, enriched in the Netherlands, deconverted in the UK and fabricated in South Korea.
The uses of nuclear technology extend well beyond the provision of low-carbon energy. It helps control the spread of disease, assists doctors in their diagnosis and treatment of patients, and powers our most ambitious missions to explore space. These varied uses position nuclear technologies at the heart of the world's efforts to achieve sustainable development. For more information, see page on Nuclear Energy and Sustainable Development.
Key statistics
In 2023 nuclear plants supplied 2602 TWh of electricity, up from 2545 TWh in 2022.
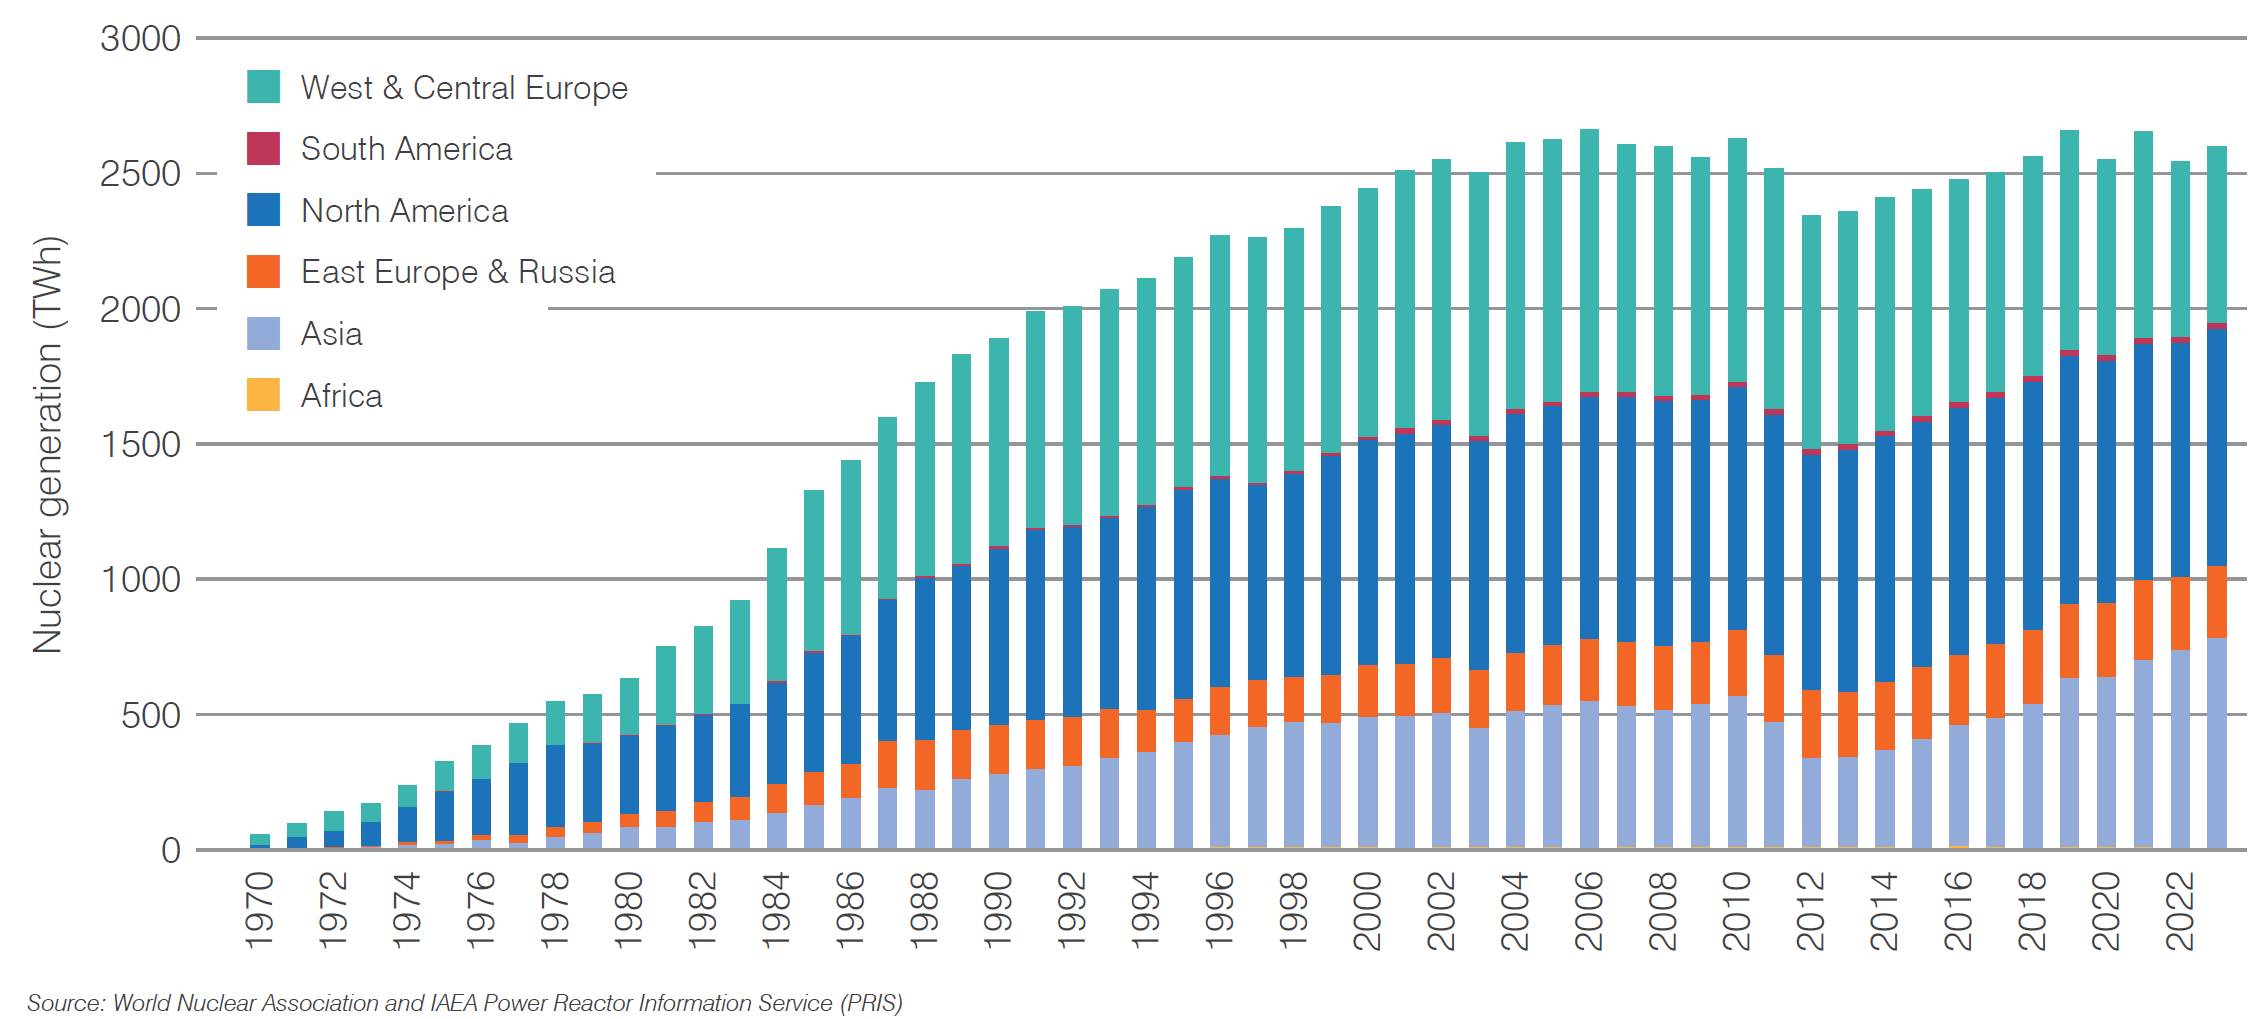
Figure 1: Nuclear electricity production 1970-2023 (source: World Nuclear Association, IAEA PRIS)

Figure 2: World electricity production by source 2020 (source: International Energy Agency)
Fourteen countries in 2023 produced at least one-quarter of their electricity from nuclear. France gets up to around 70% of its electricity from nuclear energy, while Ukraine, Slovakia and Hungary get about half from nuclear. Japan was used to relying on nuclear power for more than one-quarter of its electricity and is expected to return to somewhere near that level.
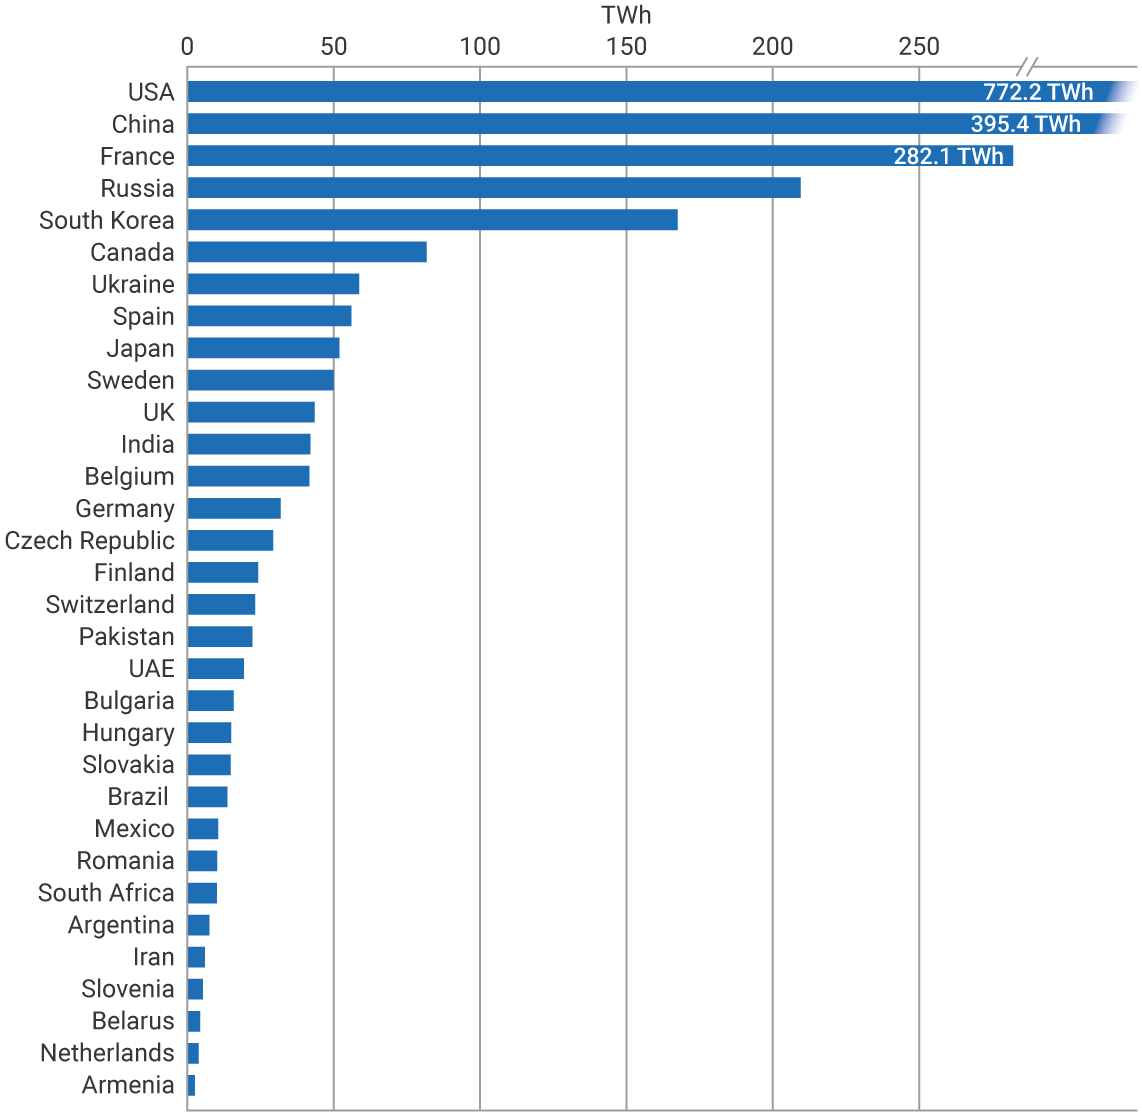
Figure 3: Nuclear generation by country 2023 (source: World Nuclear Association, IAEA PRIS)
Developments in 2024
Grid connections
Construction starts
Reactor shutdowns
World overview
All parts of the world are involved in nuclear power development. For detailed country-level information, see the Country Profiles section of World Nuclear Association's Information Library.
|
COUNTRY (Click name for |
|
|
|
|
|
|
||||||
|
TWh |
|
|
|
|
|
|
|
|
|
|
||
| Argentina |
9.0
|
6.3
|
3
|
1641
|
1
|
29
|
1
|
1150
|
1
|
750
|
219
|
|
|---|---|---|---|---|---|---|---|---|---|---|---|---|
| Armenia |
2.5
|
31.1
|
1
|
416
|
0
|
0
|
0
|
0
|
1
|
1060
|
55
|
|
| Bangladesh |
0
|
0
|
0
|
0
|
2
|
2400
|
0
|
0
|
2
|
2400
|
371
|
|
| Belarus |
11.0
|
28.6
|
2
|
2220
|
0
|
0
|
0
|
0
|
0
|
0
|
357
|
|
| Belgium |
31.3
|
41.2
|
5
|
3908
|
0
|
0
|
0
|
0
|
0
|
0
|
516
|
|
| Brazil |
13.7
|
2.2
|
2
|
1884
|
1
|
1405
|
0
|
0
|
8
|
8000
|
339
|
|
| Bulgaria |
15.5
|
40.4
|
2
|
2006
|
0
|
0
|
2
|
2300
|
0
|
0
|
334
|
|
| Canada |
83.5
|
13.7
|
19
|
13,699
|
0
|
0
|
2
|
400
|
9
|
5700
|
1455
|
|
| China |
406.5
|
4.9
|
56
|
54,362
|
30
|
34,661
|
37
|
39,860
|
158
|
186,450
|
13,132
|
|
| Czech Republic |
28.7
|
40.0
|
6
|
4212
|
0
|
0
|
1
|
1200
|
3
|
3600
|
715
|
|
| Egypt |
0
|
0
|
0
|
0
|
4
|
4800
|
0
|
0
|
0
|
0
|
0
|
|
| Finland |
32.8
|
42.0
|
5
|
4394
|
0
|
0
|
0
|
0
|
0
|
0
|
616
|
|
| France |
323.8
|
64.8
|
56
|
61,370
|
1
|
1650
|
0
|
0
|
6
|
9900
|
8232
|
|
| Germany |
6.7
|
1.4
|
0
|
0
|
0
|
0
|
0
|
0
|
0
|
0
|
0
|
|
| Ghana | 0 | 0 | 0 | 0 | 0 | 0 | 0 | 0 | 1 | 1000 | 0 | |
| Hungary |
15.1
|
48.8
|
4
|
1916
|
0
|
0
|
2
|
2400
|
0
|
0
|
320
|
|
| India |
44.6
|
3.1
|
23
|
7425
|
7
|
5900
|
12
|
8400
|
28
|
32,000
|
1725
|
|
| Iran |
6.1
|
1.7
|
1
|
915
|
1
|
1057
|
2
|
1417
|
6
|
5200
|
153
|
|
| Japan † |
77.5
|
5.6
|
33
|
31,679
|
2
|
2756
|
1
|
1385
|
8
|
11,562
|
2180
|
|
| Kazakhstan |
0
|
0
|
0
|
0
|
0
|
0
|
0
|
0
|
1
|
1200
|
0
|
|
| Korea RO (South) |
171.6
|
31.5
|
26
|
25,825
|
2
|
2680
|
2
|
2800
|
0
|
0
|
4309
|
|
| Mexico |
12.0
|
4.9
|
2
|
1552
|
0
|
0
|
0
|
0
|
2
|
2000
|
237
|
|
| Netherlands |
3.8
|
3.4
|
1
|
482
|
0
|
0
|
0
|
0
|
2
|
2000
|
69
|
|
| Pakistan |
22.4
|
17.4
|
6
|
3262
|
0
|
0
|
1
|
1170
|
0
|
0
|
555
|
|
| Poland |
0
|
0
|
0
|
0
|
0
|
0
|
3
|
3750
|
26
|
10,000
|
0
|
|
| Romania |
10.3
|
18.9
|
2
|
1300
|
0
|
0
|
2
|
1440
|
6
|
462
|
185
|
|
| Russia |
204.0
|
18.4
|
36
|
26,802
|
4
|
3988
|
14
|
8930
|
36
|
37,716
|
5436
|
|
| Saudi Arabia |
0
|
0
|
0
|
0
|
0
|
0
|
0
|
0
|
2
|
2900
|
0
|
|
| Slovakia |
17.0
|
61.3
|
5
|
2308
|
1
|
471
|
0
|
0
|
1
|
1200
|
527
|
|
| Slovenia |
5.3
|
36.8
|
1
|
688
|
0
|
0
|
0
|
0
|
1
|
1200
|
127
|
|
| South Africa |
8.2
|
4.4
|
2
|
1854
|
0
|
0
|
0
|
0
|
2
|
2400
|
277
|
|
| Spain |
54.4
|
20.3
|
7
|
7123
|
0
|
0
|
0
|
0
|
0
|
0
|
1218
|
|
| Sweden |
46.6
|
28.6
|
6
|
6944
|
0
|
0
|
2
|
2500
|
0
|
0
|
932
|
|
| Switzerland |
23.4
|
32.4
|
4
|
2973
|
0
|
0
|
0
|
0
|
0
|
0
|
412
|
|
| Turkey |
0
|
0
|
0
|
0
|
4
|
4800
|
0
|
0
|
8
|
9600
|
882
|
|
| Ukraine † ‡ |
49.6
|
50.7
|
15
|
13,107
|
2
|
1900
|
2
|
2500
|
7
|
8750
|
1673
|
|
| UAE |
31.2
|
19.7
|
4
|
5348
|
0
|
0
|
0
|
0
|
2
|
2800
|
853
|
|
| United Kingdom |
37.3
|
12.5
|
9
|
5883
|
2
|
3440
|
2
|
3340
|
2
|
2300 |
817
|
|
| USA |
779.2
|
18.6
|
94
|
96,952
|
0
|
0
|
0
|
0
|
13
|
10,500
|
18,137
|
|
| Uzbekistan |
0
|
0
|
0
|
0
|
0
|
0
|
0
|
0
|
2
|
2400
|
0
|
|
|
WORLD*
|
2602
|
c. 9%
|
439
|
395,388
|
64
|
71,397
|
88
|
84,942
|
344
|
365,050
|
67,517
|
|
|
TWh
|
% e
|
No.
|
MWe
|
No.
|
MWe
|
No.
|
MWe
|
No.
|
MWe
|
tonnes U
|
||
67,517 tU = 79,619 t U3O8
Operable = Connected to the grid.
Under Construction = First concrete for reactor poured.
Planned = Approvals, funding or commitment in place, mostly expected to be in operation within the next 15 years.
Proposed = Specific programme or site proposals; timing very uncertain.
* World figures include Taiwan, which generated a total of 17.2 TWh from nuclear in 2023 (accounting for 6.9% of Taiwan's total electricity generation). As of July 2024 the island has one operable reactor with a net capacity of 938 MWe.
† Under Construction figures include a number of units where construction is currently suspended: Angra 3 (Brazil); Ohma 1 and Shimane 3 (Japan); Khmelnitski 3&4 (Ukraine).
‡ Ukraine 2023 electricity generation estimated.
Emerging nuclear energy countries
As outlined above, Bangladesh and Turkey are constructing their first nuclear power plants. A number of other countries are moving towards use of nuclear energy for power production. For more information, see page on Emerging Nuclear Energy Countries.
Improved performance from existing reactors
The performance of nuclear reactors has improved substantially over time. Over the last 40 years the proportion of reactors reaching high capacity factors has increased significantly.

Figure 4: Long-term trends in capacity factors (source: World Nuclear Association, IAEA PRIS)
It is also notable that there is no significant age-related trend in the mean capacity factor for reactors over the last five years.
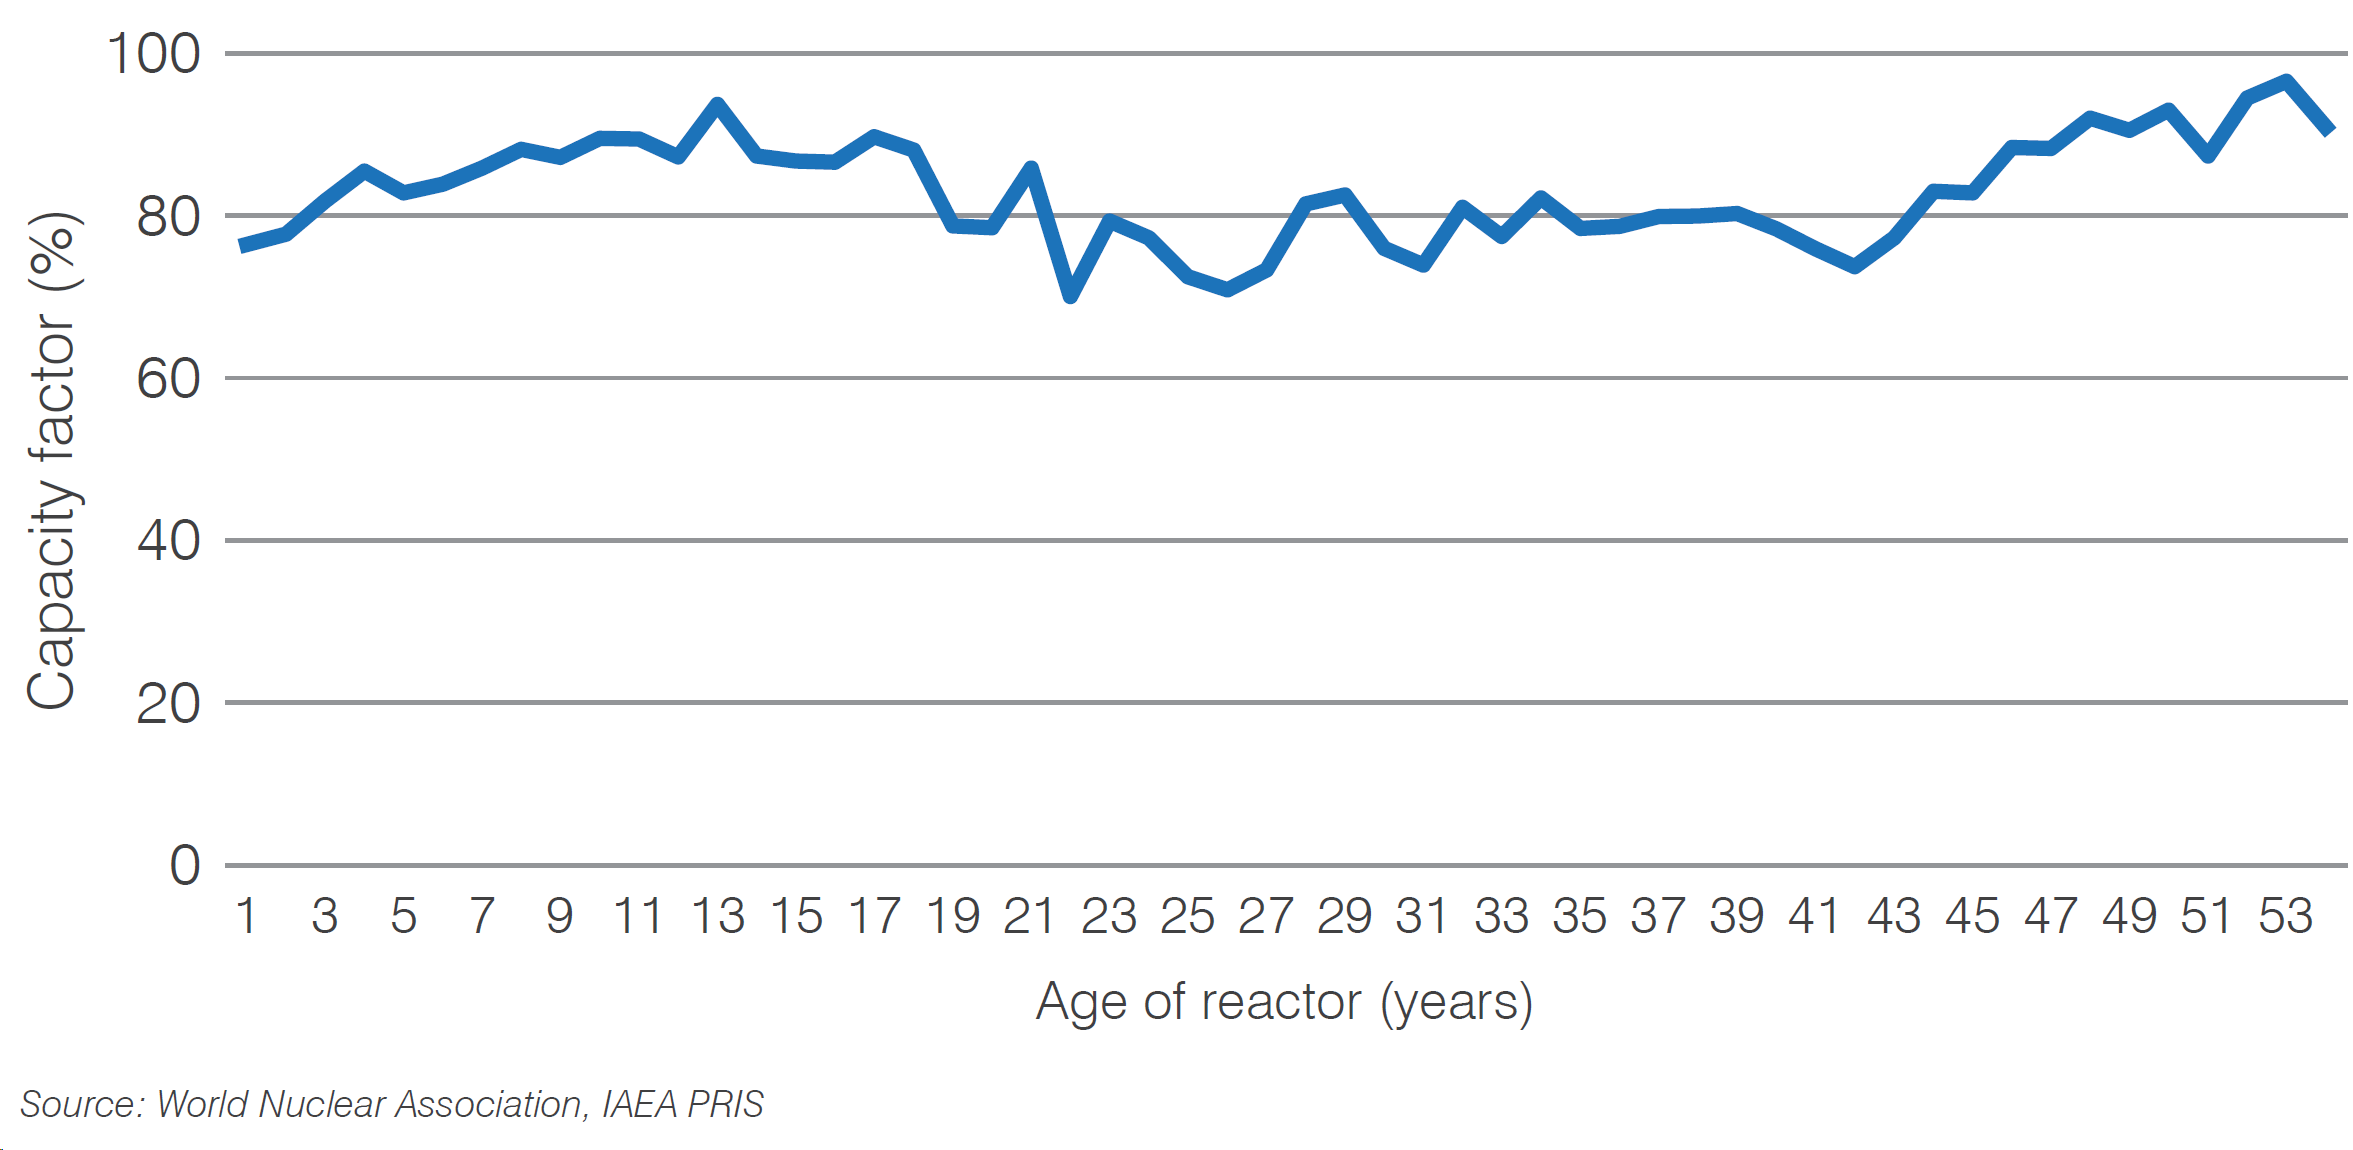
Figure 5: Mean capacity factor 2018-2023 by age of reactor (source: World Nuclear Association, IAEA PRIS)
Need for new generating capacity
There is a clear need for new generating capacity around the world, both to replace old fossil fuel units, especially coal-fired ones, which emit large amounts of carbon dioxide, and to meet increased demand for electricity in many countries. In 2022, 61% of electricity was generated from the burning of fossil fuels. Despite the strong support for, and growth in, intermittent renewable electricity sources in recent years, the fossil fuel contribution to power generation has not changed significantly in the last 15 years or so (66.5% in 2005).
The OECD International Energy Agency publishes annual scenarios related to energy. In its World Energy Outlook 20231 the Net Zero Emissions by 2050 Scenario (NZE) "maps out a way to achieve a 1.5°C stablization in the rise in global average temperatures, alongside universal access to modern energy by 2030." The NZE in WEO 2023 sees nuclear capacity increase to 916 GWe by 2050. See information page on IEA Scenarios and the Outlook for Nuclear Power.
Other nuclear reactors
In addition to commercial nuclear power plants, there are about 220 research reactors operating in over 50 countries, with more under construction. As well as being used for research and training, many of these reactors produce medical and industrial isotopes.
The use of reactors for marine propulsion is mostly confined to the major navies where it has played an important role for five decades, providing power for submarines and large surface vessels. Over 160 ships, mostly submarines, are propelled by some 200 nuclear reactors and over 13,000 reactor years of experience have been gained with marine reactors. Russia and the USA have decommissioned many of their nuclear submarines from the Cold War era.
Russia also operates a fleet of large nuclear-powered icebreakers and has more under construction. It has also connected a floating nuclear power plant with two 32 MWe reactors to the grid in the remote arctic region of Pevek. The reactors are adapted from those powering icebreakers.
For more information see page on The Many Uses of Nuclear Technology.
Notes & references
References
1. OECD International Energy Agency, World Energy Outlook 2023 [Back]
2. OECD International Energy Agency Statistics [Back]
General references
World Nuclear Association, World Nuclear Performance Report 2023
Related information
Nuclear Energy and Sustainable DevelopmentWorld Energy Needs & Nuclear Power
Plans For New Reactors Worldwide
The Many Uses of Nuclear Technology
What is Uranium? How Does it Work?
Financing Nuclear Energy